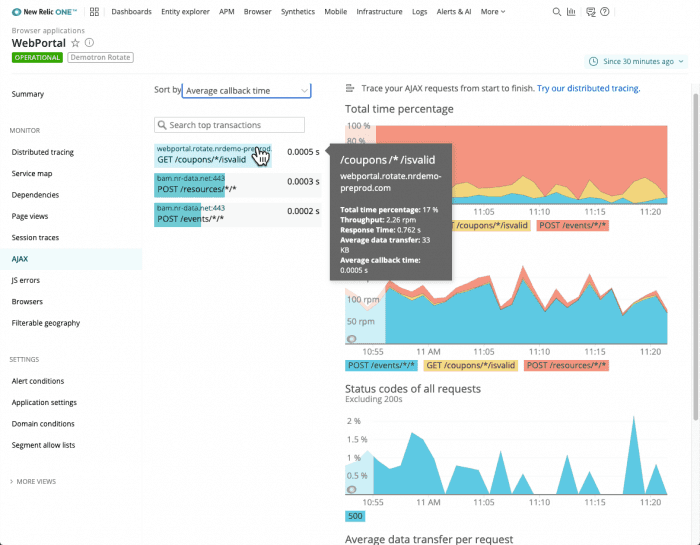
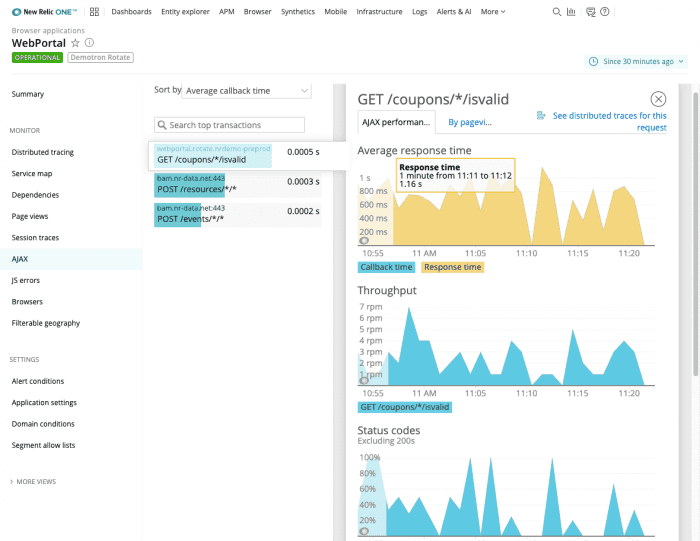
Our browser monitoring's AJAX UI shows recent AJAX requests from browsers to external endpoints, such as HTTP or HTTPS domains. This information helps identify problems with the end user experience when you have time-consuming or failing AJAX calls that update parts of a webpage on your site.
What to troubleshoot
Here are some troubleshooting tips for identifying performance problems with your app:
Troubleshooting AJAX calls | Examples |
|---|---|
Problems across the entire request | If you're not sure where the problem is, or if you want to trace your requests from start to finish, click the distributed tracing link in the AJAX UI. |
Timing problems | Total time percentages, throughput requests per minute (rpm), and average data transfer rates per request can help identify timing problems.
|
Endpoint problems | Look for any outlier endpoints, and investigate individual requests made from them. The Status codes chart on the AJAX summary page provides information about the return behavior from the call. If you see a large number of status codes outside the |
Specific webpage location problems | Examine potential AJAX problems within the context of the page where they load. Select an AJAX transaction, then select any trace from the Session traces with AJAX table. |
How to do it
To troubleshoot problems with AJAX requests for your app:
Go to one.newrelic.com > Browser > (select an app) > AJAX.
OR
Go directly to the selected app's Browser summary page, then click the AJAX response time chart's title.
one.newrelic.com > Browser > (select an app) > AJAX: Identify problems due to time-consuming or failing AJAX calls that update parts of a webpage on your site.
What's next
In addition to the AJAX UI, you can also use these resources:
- Help prevent problems from occurring by using alerts and Applied Intelligence for your key performance indicators.
- Use single-page app (SPA) monitoring. This is valuable for any app that uses AJAX requests to pull content dynamically and create a fluid user experience.
- Query your data in the UI or by API. For example, you can query with default browser events, use SPA
AjaxRequestfor geographic and browser data, or get your own custom data into New Relic. - Visualize and share your data with charts and dashboards.

