Browser monitoring's session traces provide a detailed timeline of the load and interaction events during a webpage's full life cycle, for as long as ten minutes. Page load timing, individual asset loads, user interactions, AJAX requests, callbacks, errors, and other events appear in an interactive timeline which includes a detailed waterfall visualization, a heat map overview, and highlighted metrics and problems related to that session.
Identify problems and solutions
Session traces help you understand:
- How users experience your page load, including time to DOM load, time waiting for AJAX requests to complete, and the user's interactions with the page
- How the New Relic metrics reflect your end users' experiences
- What is the sequence of JavaScript and browser events, which take longer than others, and when each event occurs
- Where bottlenecks occur, and what may be causing them
- Why one page load may be slower than others, by providing the context for individual events during a session
By connecting performance to user experience and interactions to performance, this detailed and intuitive visualization of all events in the user's session can help pinpoint problem areas and easily identify solutions.
Requirements
To use browser session traces feature, make sure you meet these requirements:
- Requires the Pro or Pro+SPA agent type
- Your agent version must support browser monitoring.
- If you're using multiple names for an app, session traces will only report to the most specific application.
Browser randomly captures traces only from browsers that support the Resource Timing API.
Select a session trace
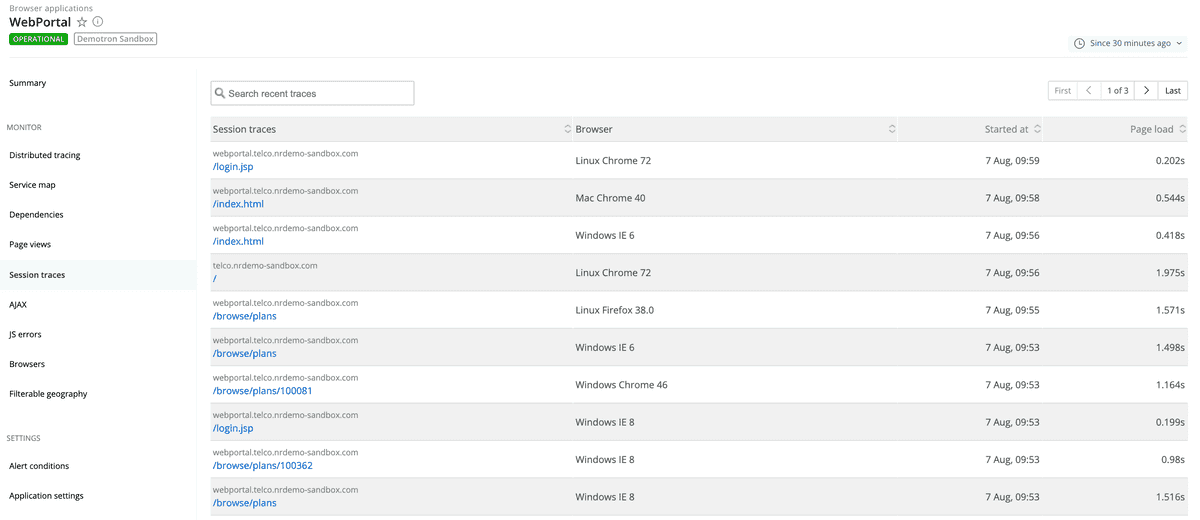
The Session traces index lists the most recent traces based on the time picker selection for the selected app. Session traces are randomly sampled and stored at a rate of 90/hour.
You can page through up to 500 traces at a time. Additionally, you can sort and search the list by attributes, including:
- Full URL, with query string parameters removed
- Browser type
- Started at date/time
- Page load time
one.newrelic.com > Browser > (select an app) > Session traces: You can select a session trace from the browser index.
To select a specific session trace:
- Go to one.newrelic.com and click Browser > (select an app) > Session traces.
- To locate a session trace from a different date or time period, use the time picker.
- To limit the index to a specific type of trace, use the search window.
- To view detailed information, select the session trace's link.
View session trace details
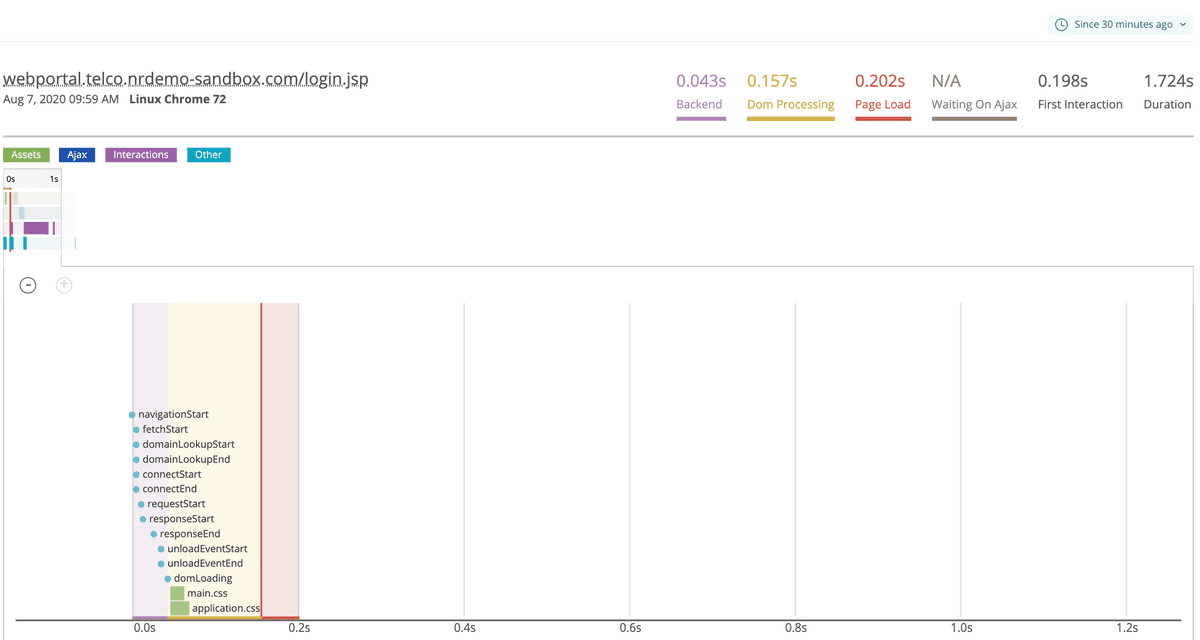
The Session trace details page provides summary information about the trace, a heat map with timing details, and a waterfall of events that you can explore. The color-coded legend identifies the page load events during the webpage's life cycle.
For apps that have been deployed using the copy/paste method, browser monitoring includes web app and queue time in Network time as part of the page load timing process. This is because browser relies on the server-side agent to pass the application values to the browser agent through auto-injection.
You can view detailed information about how this "back end" time breaks down from the browser's point of view. The session traces report on all the network related events available, so you can see on a case-by-case basis how the browser spends time on DNS lookups and other network events.
one.newrelic.com > Browser > (select an app) > Session traces > (select a trace): Use Browser's session trace details to examine events and identify problems during the end user's webpage session.
To navigate through a session trace, explore the waterfall chart by scrolling vertically through the event stack, or select individual events to view their details.
If you want to... | Do this... |
|---|---|
View the web page for this session trace | Select the trace link. |
Jump to a specific time | Select the time indicator or event on the heat map. |
View details about individual events | Select any event in the waterfall chart. From there, select View full details if applicable. |
Change the location on the session trace | Click on the heat map, or scroll vertically through the waterfall chart. |
Zoom in or out of the overall trace | Select the plus or minus icons below the heat map. |
Share the session trace information | Create a permalink to paste into a form, ticket, email, etc. |
Session segment definitions
Important session trace measurements are displayed in the upper right corner of the Session traces page. The first four measurements represent how long into a session that the segment ended. For example, if Page Load is 0.202s, that means that the page load event completed 0.202 seconds after the request began.
Session segment | Description |
|---|---|
Backend | The time from when the request began to when backend activity finished and DOM loading began. |
DOM processing | The time from when the request began to when DOM processing finished. |
Page load | The time from when the request began to when the page load event fired. |
Waiting on AJAX | The time from when the request began to when AJAX activity ended. |
First interaction | The time from when the request began to when the first user activity, like a mouse click or a scroll, was recorded. |
Duration | The total duration of the session. |
Slow JavaScript execution and repainting
Session traces help you identify callbacks in your JavaScript code that execute slowly and block the execution of subsequent calls on the browser's main thread. These calls should execute quickly in order to allow the browser to quickly repaint the page in response to user actions.
Session traces highlight any callbacks longer than 33ms. If called in rapid succession (such as inside a requestAnimationFrame loop), callbacks longer than 33ms reduce the frame rate below 30 frames per second. This speed seems sluggish to users.

