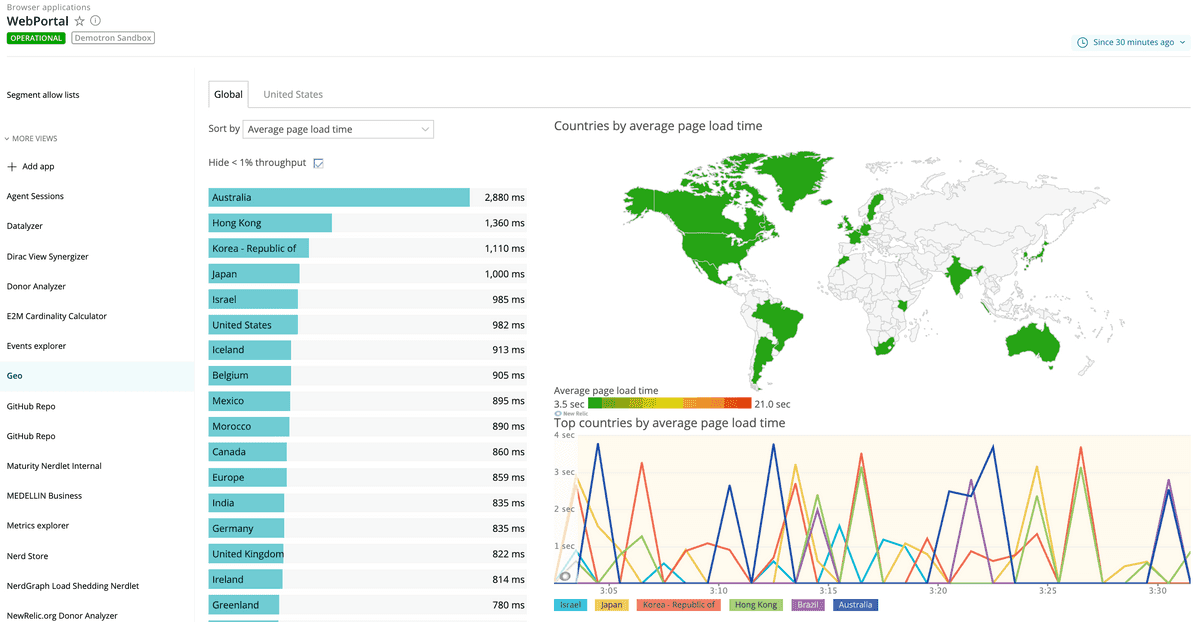
Browser monitoring's Geography page provides a world view with color-coded Apdex scores and other performance information about your end users' experience. You can select specific geographic regions, such as countries or states, and then you can drill down to detailed information about page load performance and historical performance.
Contents
View performance data by region
Important
Firewalls may have an impact on the geographical data collected about your end users.
To view or sort the performance information by location:
one.newrelic.com > Browser > (select an app) > Geo: This page provides a world view and drill-down details of color-coded performance information for geographic locations.
Go to one.newrelic.com > Browser > (select an app) > Geo > Global (for a world view).
OR
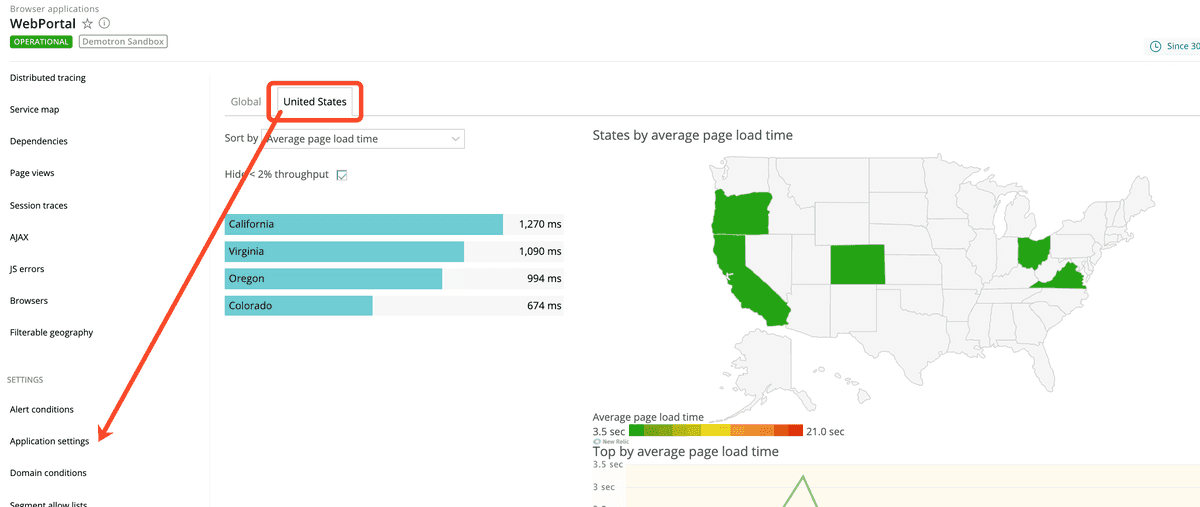
Go to one.newrelic.com > Browser > (select an app) > Geo > (select a location) (for a specific location you identified in the Browser application settings).
To drill down to a specific area, select a location from the list, or select any area on the geographical map.
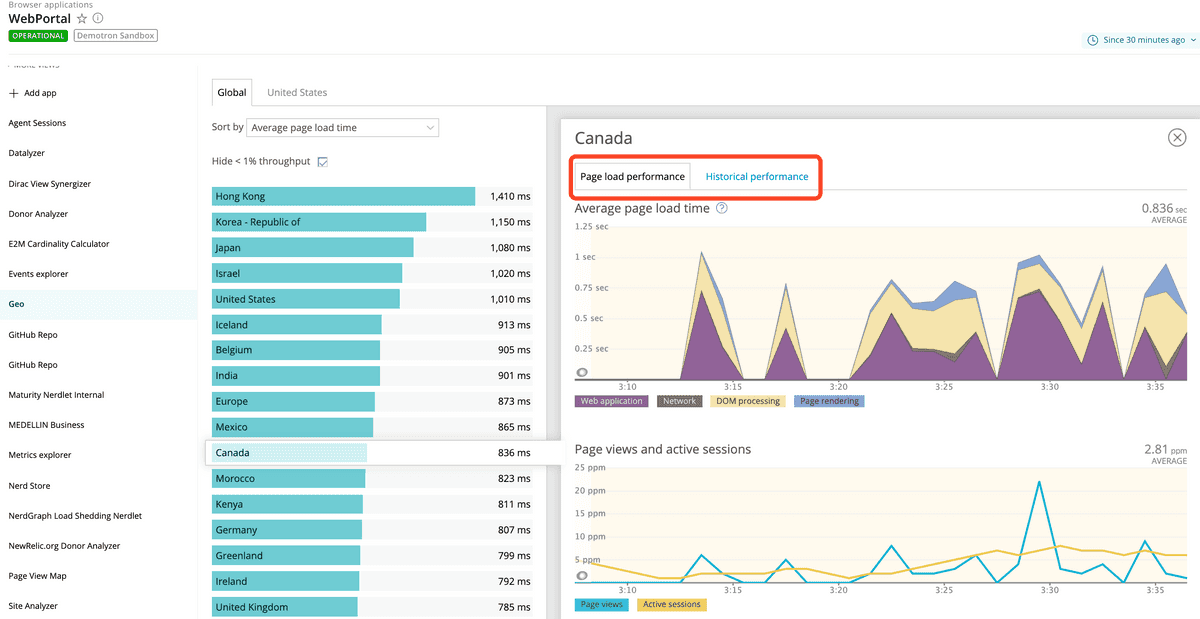
To view additional details about the selected location, select the Page load performance or Historical performance links.
To return to the main Geography page, select X (Close).
one.newrelic.com > B**rowser > (select an app) > Geo > (select a location): If you selected specific locations from Settings > Application settings**, the Geography page includes tabs to view their performance data directly.
Use page functions
Use any of our standard user interface functions and page functions to drill down into detailed information.
Here is a summary of additional options with the Geography page:
If you want to... | Do this... |
|---|---|
Change how the performance data appears | Select your choice from the Sort by menu. |
Adjust the amount of information that appears | Select or clear the Hide <% throughput checkbox (<1% for global view, <2% for selected locations). |
View a map of a specific location | Do any of these as applicable:
|
View summary performance information about a specific location | Mouse over any colored area. |
View drill-down details
After you select a specific location, the Page load performance page shows:
- Average page load time in seconds
- Number of page views and active sessions as pages per minute (ppm)
- Recent browser traces if applicable
one.newrelic.com > Browser > (select an app) > Geo > (select a location): After you select a specific location, you can view specific details about Page load performance and Historical performance.
In addition, the Historical performance page shows comparison data for the selected time period, yesterday, and last week for the selected location. This includes:
- Response time
- Apdex
- Throughput in pages per minute (ppm)


