Distributed tracing helps you monitor and analyze the behavior of your distributed system. After you enable distributed tracing, you can use our UI tools to search for traces and analyze them.
For example, let's say you are an engineer troubleshooting errors in a complex transaction spanning many services. Here's what you can do in our UI:
- Open the distributed tracing UI page.
- Sort through your traces using a filter to find that specific request and show only traces containing errors.
- On the trace details page, you review the span along the request route that originated the error.
- Noting the error class and message, navigate to the service from its span in the trace so you can see that the error is occurring at a high rate.
Read on to explore the options in the distributed tracing UI.
Open the distributed tracing UI
Here's how you can access the distributed tracing UI, depending on the type of search you want to do:
Find traces that are useful
We have a variety of tools to help you find traces and spans so you can resolve issues. The opening distributed tracing page is populated with a default list of traces, and you can quickly refine this list using these tools:
Tip
In addition to these tools, you can also use other options mentioned in Query distributed trace data.
Filter using the query bar
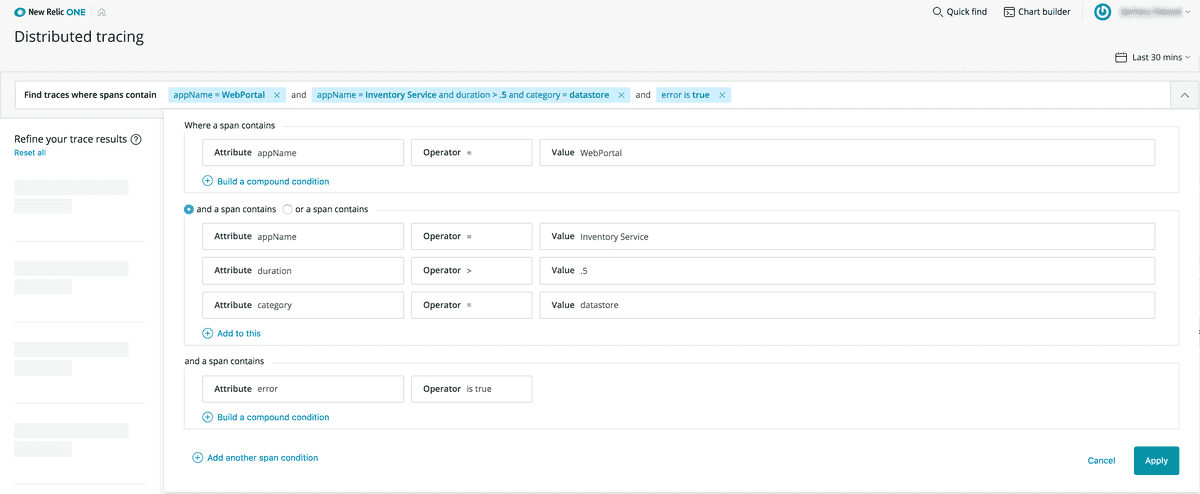
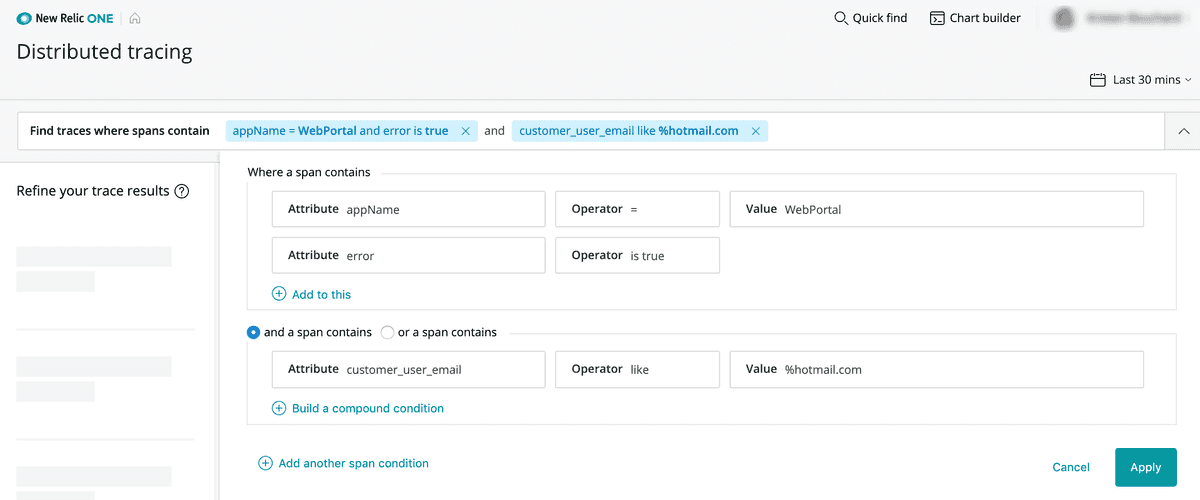
The Find traces query bar is a quick way to narrow your search for traces. You can either start typing in the query bar or use the dropdown to create a compound query.
Query returns are based on span attributes, not on trace attributes. You define spans that have certain criteria, and the search displays traces that contain those spans.
If you use a multi-attribute filter, it is affected by first attribute selected. Distributed tracing reports on two types of data: transaction events and spans. When you select an attribute in the filter, the data type that attribute is attached to dictates the available attributes. For example, if you filter on an attribute that is attached to a transaction event, only transaction event attributes are available when you attempt to add filter on additional attribute values.
Queries for traces are similar to NRQL (our query language). Here are the main exceptions:
- String values don't require quote marks (for example, you can use either
appName = MyApporappName = 'MyApp') - The
likeoperator doesn’t require%(for example, you can use eitherappName like productorappName like %product%).
Tip
Some queries that return a large number of results may return false positives. The trace list limits these incorrect results to 10% of the returned results. False positives may also result in histogram chart results that are not displayed in the trace list.
Here are two query bar examples:
Trace groups
The default view of distributed tracing shows traces grouped by the same root entry span. In other words, traces are grouped by the span where New Relic began recording the request. You can slide the toggle Group similar traces to turn this on and off.
With trace groups you get a high-level view of traces so you can understand request behavior for groups of similar traces. This helps you understand dips or spikes in trace count, duration, and errors.
When you click on one of the trace groups, you get all the standard details in context of the specific trace group you selected.
Filter using the scatter plot
The trace scatter plot is a quick way to search for outlying traces. This is available on the opening page of distributed tracing if you turn off the Group similar traces toggle at the top of the page.
In the scatter plot, you can move the cursor across the chart to view trace details and you can click individual points to get details:
Here's how you can control what's displayed in the scatter plot:
- In the View by dropdown, select the duration type:
- Back-end duration
- Root span duration
- Trace duration
- In Group traces by, select one of these options:
- Errors: Group by whether or not traces contain errors.
- Root service: Group by the name of the first service in traces. In a trace where Service A calls Service B and Service B calls Service C, the root service would be Service A.
- Root entry span: Group by the root transaction, which is the root service's endpoint. In a trace where Service A calls Service B and Service B calls Service C, the root entry span is Service A's endpoint. For example: "Service A - GET /user/%".
- Service entry span: Group by the span name of the service currently being viewed in APM. For example, for a trace where Service A calls Service B and Service B calls Service C, if you're viewing Service B in APM and select this grouping, the traces will be represented by their Service B span names. If a service has multiple spans in a trace, this grouping option will use that service's first entry point.
Filters
In the left pane, you can filter traces by multi-span traces, specific entities, or error types. Once you select a filter, only traces associated with that specific type are displayed. This makes it much easier to view the traces you're most interested in so you can find and fix issues faster.
Trace histograms
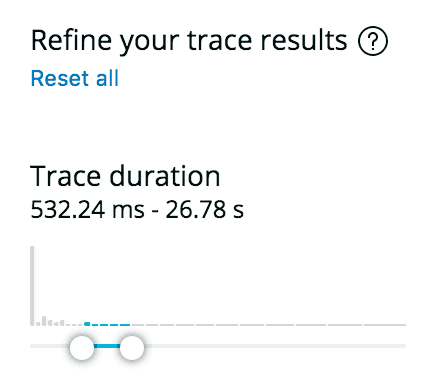
The histogram charts give you a quick understanding of trace distribution for important values, such as duration. Click Show filters at the bottom of the left pane to display the histograms. When you move the histogram sliders, they change the data displayed in the scatterplot or the trace group charts.
For example, you can drag the Trace duration chart slider to show only traces over 500 ms, as shown in the histogram example below.
Important
Some queries that produce many results may result in false positives in histograms. This could manifest as histograms showing trace results that are not in the trace list.
Trace details UI page
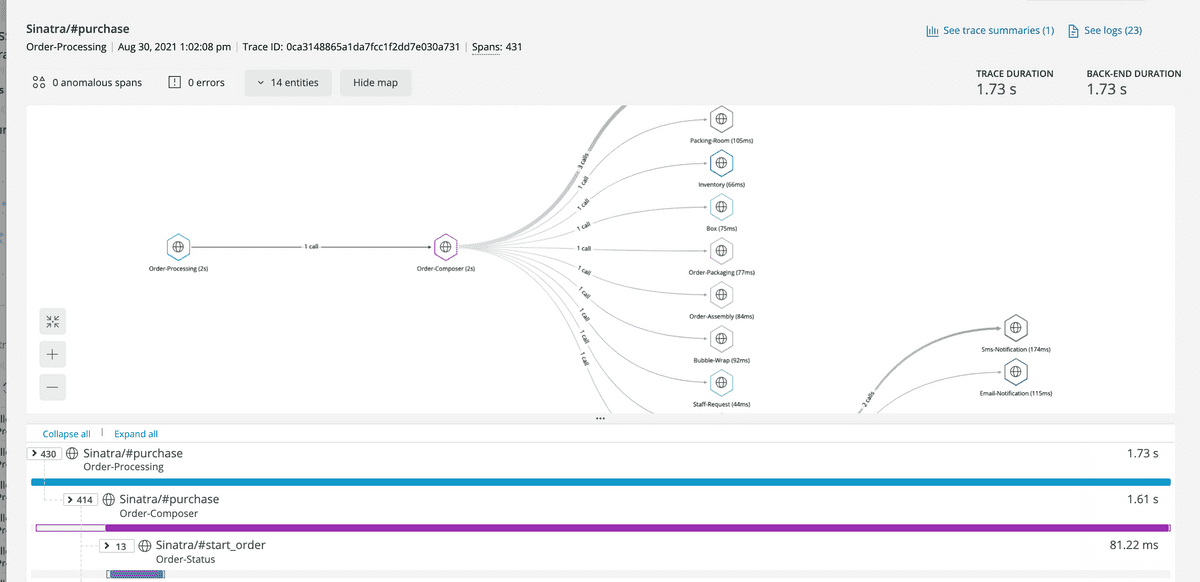
When you select a trace from the trace list, you see a map of services (if available), and a "waterfall" display of that trace's spans.
When you select a trace from the list of traces, you see details about it.
Trace map
If a trace involves more than one entity, and we have information about those entities, the trace page includes a map. For more about how that, see Maps in context.
Span properties
The UI indicates span properties with these icons:
Span property | Indicator | Description |
|---|---|---|
Service | This icon represents a span that's a service's entry point. | |
In-process | This icon represents an in-process span, which is a span that takes place within a process (as opposed to a cross-process span). Examples: middleware instrumentation, user-created spans. | |
Datastore | This icon represents a span call to a datastore. | |
External | This icon represents category representing a call to an external service made via HTTP. | |
Browser app | This icon represents a browser application span. | |
Lambda | This icon represents a span from a Lambda function. |
Some spans will have additional indicators:
Span property | Indicator | Description |
|---|---|---|
Type of connection | Solid lines indicate a direct parent-child relationship; in other words, one process or function directly calling another. A dotted line indicates a non-direct relationship. For more on relationships between spans, see Trace structure. | |
Errors | A span with an error. See How to understand span errors. | |
Anomalous | This icon represents the detection of an anomalous span. | |
Orphaned spans | Some spans may be "orphaned," or separated, from the trace. These spans will appear at the bottom of the trace. For more details, see Fragmented traces. | |
Multiple app names | When beside a span name, this represents an entity that has had multiple app names set. Select this to see all app names it reports to. To search trace data by alternate app names, use the | |
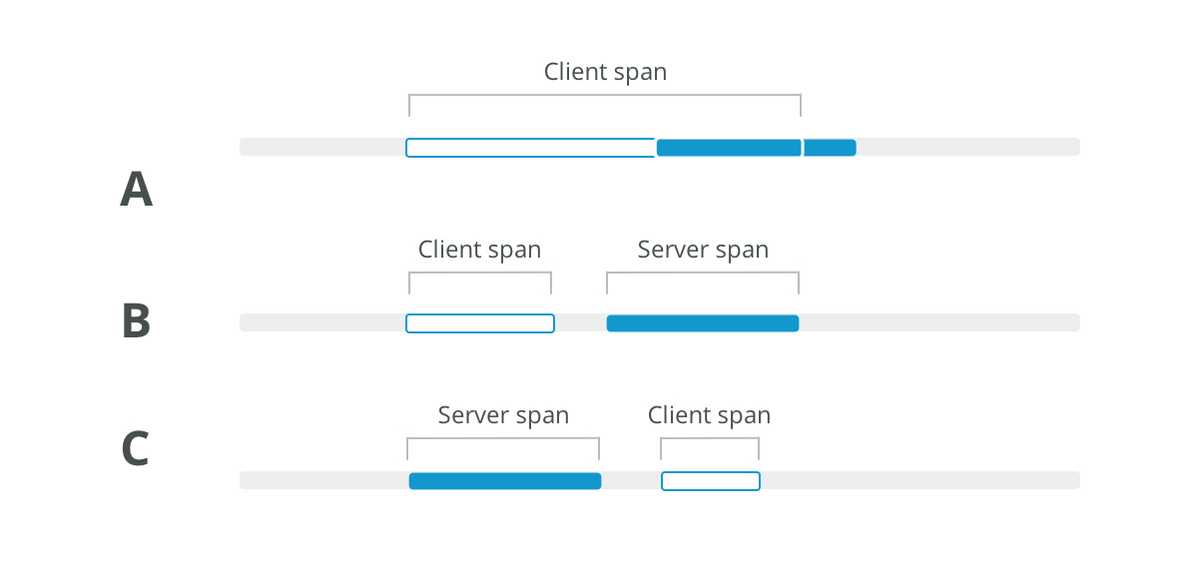
Client/server time difference | If a span's duration indicator is not completely colored in (like in this example), it means that there is a time discrepancy between the server-side duration and the client-side duration for that activity. For details on this, see Client/server time difference. |
For more on the trace structure and how span properties are determined, see Trace structure.
Span details pane
When you select a span, a pane opens up with span details. These details can be helpful for troubleshooting performance issues. Details include:
- Performance charts
- Span attributes
- The span's data source
- Anomalous span details
- The span's full name
What a span displays is based on its span type. For example, a datastore span's name attribute will contain the datastore query.
View related logs
If you are using our logs in context feature, you can see any logs that are linked to your traces:
- Go to the trace details page by clicking on a trace.
- Click See logs in the upper-right corner.
- For details related to an individual log message, click directly on the message.
Additional UI details
Here are some additional distributed tracing UI details, rules, and limits:
