New Relic's infrastructure monitoring agent is a lightweight executable file that collects data about your hosts. It also forwards data from our on-host integrations to New Relic, as well as log data for log analytics.
The infrastructure monitoring agent can currently run on many Linux distributions, Windows, and macOS. There are multiple ways to install and deploy the agent, depending on your setup and needs. This document describes how the infrastructure monitoring agent works and how to install it. You'll need a New Relic account, so if you don't have one already, create it for free, forever.
Quick start: Use our guided install
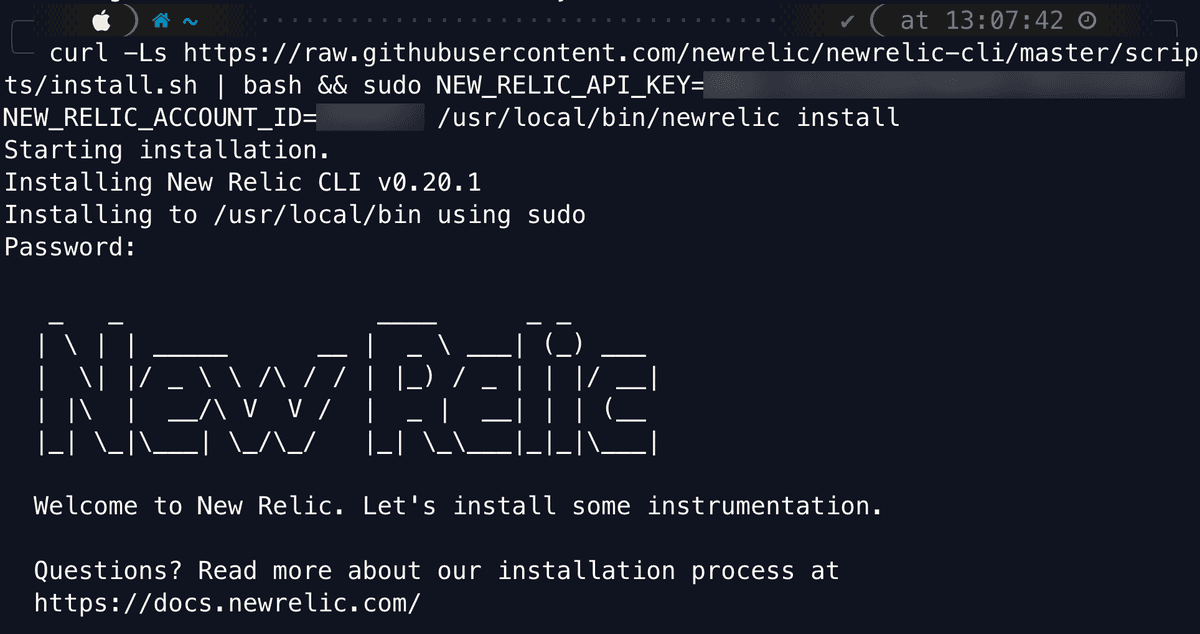
The quickest way to get started with our infrastructure monitoring agent is through our guided install. Our guided install not only installs the infrastructure agent, but also discovers the applications and log sources running in your environment. It recommends which ones you should instrument.
Ready to get started? You'll need a New Relic account before you can install. Click one of these button to try it out.
The guided install works with most setups. But if it doesn't suit your needs, you can find other methods below to get started monitoring your infrastructure.
For more information on where you can run the agent, check the compatibility and requirements page.
Important
If you install the agent using the New Relic One UI, the Infrastructure status API is enabled by default.
Install the infrastructure monitoring agent
Linux
If you don't have a New Relic account yet, the guided install won't work. If you want to follow the procedure manually, see our tutorial.
Windows Server and 10
If you don't have a New Relic account yet, the guided install won't work. If you want to follow the procedure manually using our MSI installer, see our tutorial.
Other installation scenarios
The infrastructure monitoring agent can be deployed programmatically using several config management and deploy tools:
-
 Ansible
 -
 Chef
Chef -
 Docker (install as container)
 -
 Elastic Beanstalk
 -
 Puppet
Infrastructure can also be deployed in macOS.
One agent, many capabilities
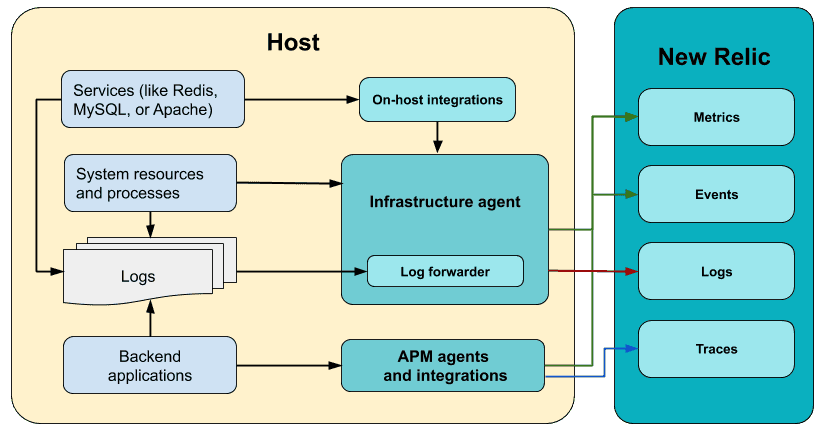
Our infrastructure monitoring agent collects performance and health data about the system resources and processes of the host where it's enabled (on-premises or virtualized). At the same time, it acts as a forwarder for two types of data: core services metrics, which are collected by on-host integrations, and logs.
If you want to collect data about core services running on your host, you need to install the infrastructure monitoring agent first, and then install or enable on-host integrations.
Our infrastructure monitoring agent and its integrations collect data from the system and core services. It can also forward logs to New Relic. Backend application metrics (APM) are collected by separate language agents. Notice how each integration and forwarder feed different data types in the New Relic database (NRDB).
Check the source code
The infrastructure monitoring agent is open source software. That means you can browse its source code and send improvements, or create your own fork and build it. For more information, see the README.
What's next
After you've installed the infrastructure monitoring agent:
- Learn how to configure the agent or edit the config template.
- Install on-host integrations (for example, Apache or MySQL).
- Enable log forwarding using the infrastructure agent.
- Learn how to manage the agent.

