As applications move towards the cloud, microservices architecture is becoming more dispersed, making the ability to monitor logs essential. New Relic offers a fast, scalable log management platform so you can connect your logs with the rest of your telemetry and infrastructure data in a single place. See how it works with this video (approx. 2 minutes).
Our log management solution provides deeper visibility into application and infrastructure performance data (events and errors) to reduce mean-time-to-resolve (MTTR) and quickly troubleshoot production incidents.
Find problems faster, reduce context switching
Log management provides a way to connect your log data with the rest of your application and infrastructure data. You can get to the root cause of problems quickly, without losing context switching between tools.
Log management features include:
- Instantly search through your logs.
- Visualize your log data directly from the Logs UI.
- Use logging data to create custom charts, dashboards, and alerts.
- Troubleshoot performance issues without switching between tools.
- Visualize everything in a single place.
Requirements
Access to log management capabilities is restricted by user type. For more details, see user type capabilities.
For users on our New Relic One user model, some log functionality is governed by several log-related capabilities.
Bring in your logging data
To forward your log data to New Relic, you can:
- Use our infrastructure monitoring agent as a lightweight data collector, without having to install additional software.
- Select from a wide range of log forwarding plugins, including Amazon, Microsoft, Fluentd, Fluent Bit, Kubernetes, Logstash, and more.
- Use our OpenTelemetry solutions.
- Send your log data by using the Log API or TCP endpoint.
Once log management is enabled, you can also connect your logs with your APM agent, Kubernetes clusters, or distributed tracing to get additional contextual logging data with our logs in context extensions.
View your logging data in New Relic
You can explore your logging data in the UI or by API:
- Logs UI at one.newrelic.com
- Logs UI for EU region data center if applicable: one.eu.newrelic.com
You can also query the Log data type. For example, use NRQL to run:
SELECT * FROM LogYou can also use NerdGraph, our GraphQL-format API, to request the exact data you need.
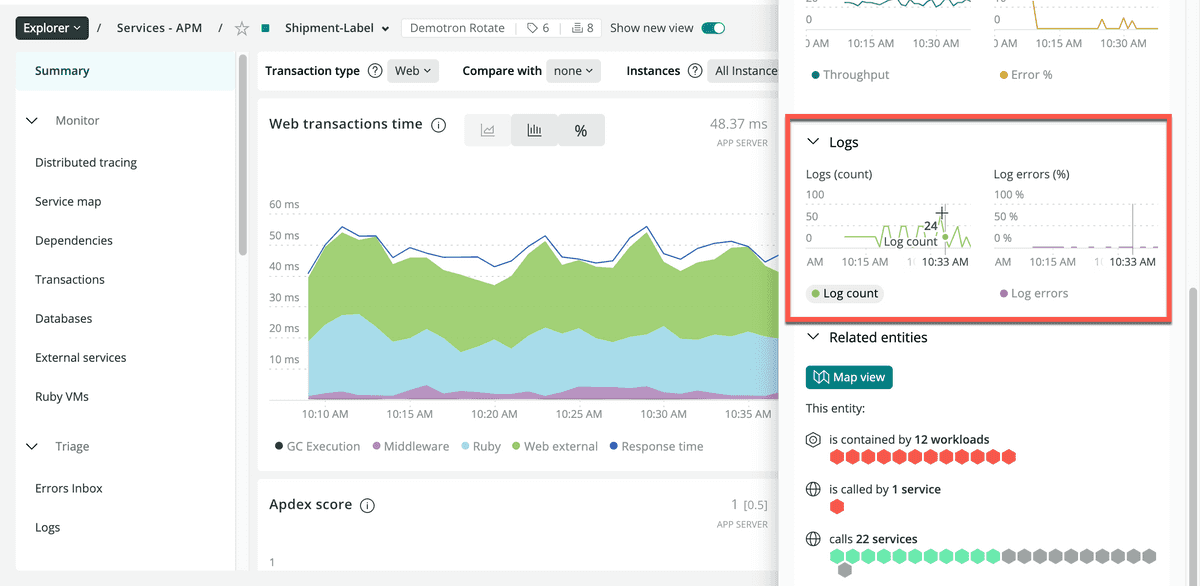
Here is an example of log data for one of an app's related entities (a workload service in this example):
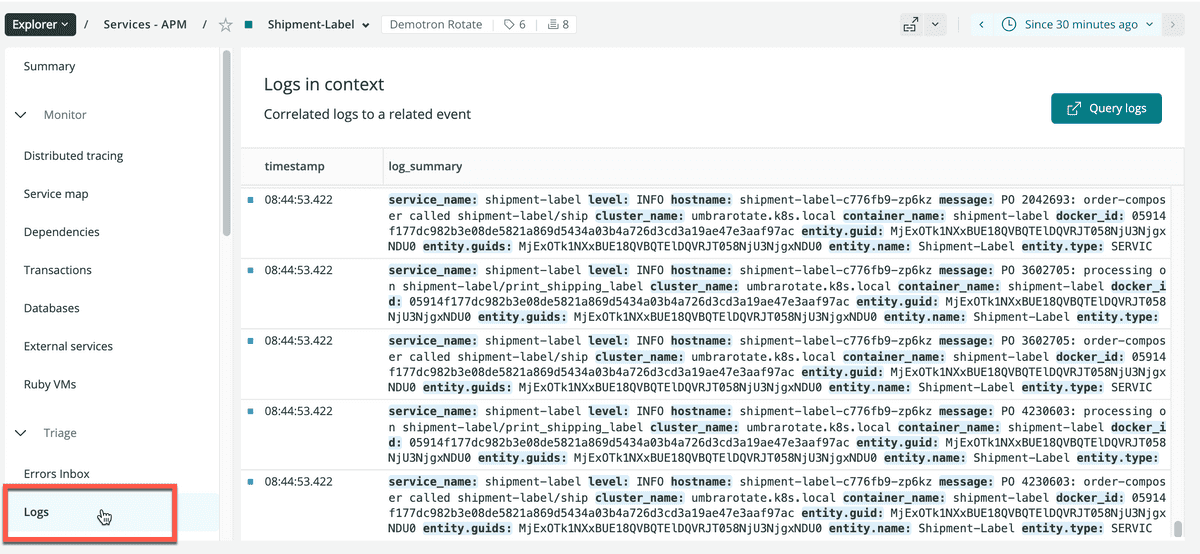
You can also see relevant logs in context, directly from the app in the APM UI or from the host in the Hosts UI in New Relic One.
From here you can drill down into detailed data, run queries, set alerts, and more.
What's next
Ready to get started with our log management solutions?
- If you don't have one already, create a New Relic account. It's free, forever.
- Enable log management by forwarding your logs to New Relic. Recommendation: Use our infrastructure agent as your log forwarder, so you can get logs in context of your platform and services directly in our UI.
- For apps monitored by a New Relic APM agent, configure logs in context.
- Explore the logging data across your platform with our Logs UI in New Relic One, where you can add alerts, query your data, and create dashboards.

