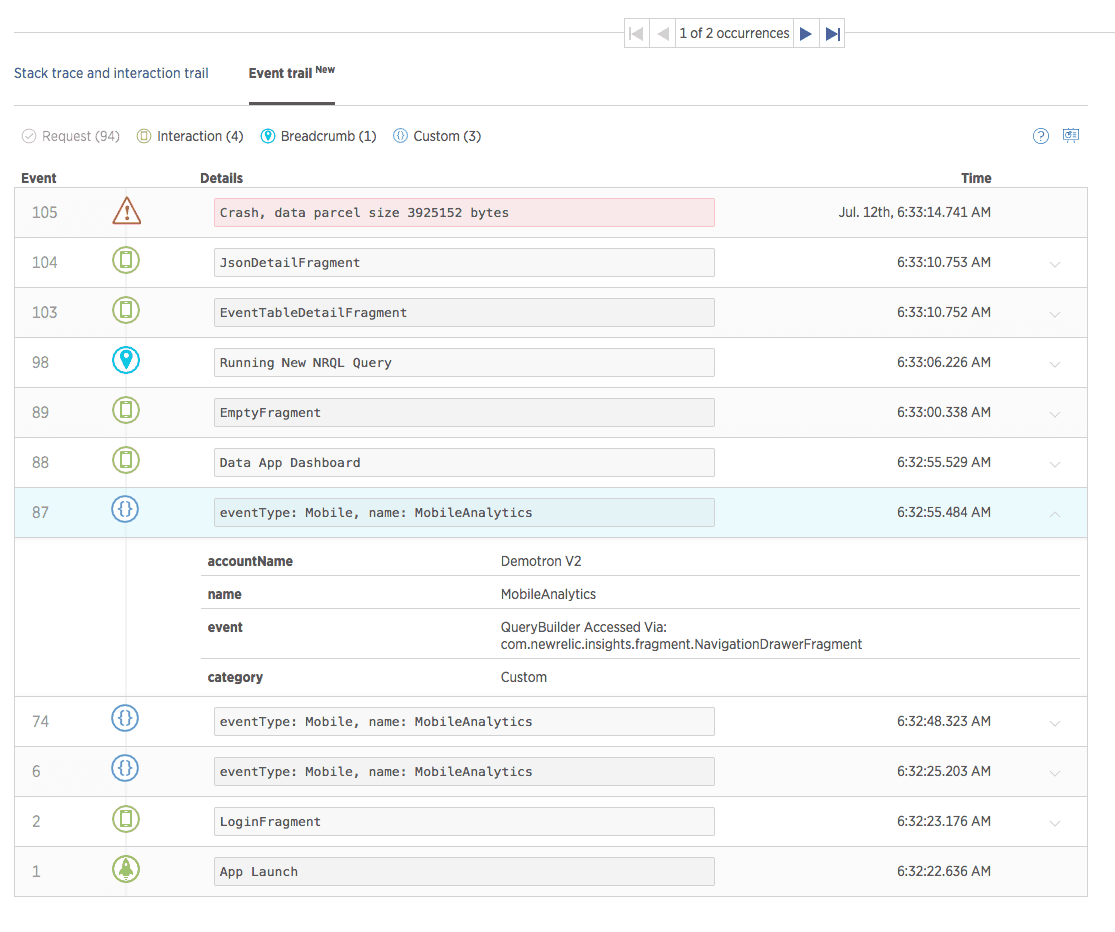
The mobile monitoring crash event trail shows you the events leading up to a crash of a mobile app, based on your subscription level's data retention policy. These can be events New Relic monitors by default, or custom events. This document explains what the crash event trail is and how to use it.
Tip
Access to this feature depends on your subscription level.
View events before mobile app crashes
When a mobile app crashes and you don't know why, you can study what happened right before the crash. The crash event trail shows you these events so that you can follow the "breadcrumbs" leading up to the crash and diagnose the cause of the failure.
one.newrelic.com > Mobile > (select a mobile app) > Crash analysis > (selected crash type) > Event trail: The crash event trail shows the activity leading up to a mobile app crash.
The crash event trail shows all mobile event types leading up to a crash. You can use the iOS SDK or Android SDK to create custom MobileBreadcrumb events that track whatever app activity you think would help you diagnose a crash.
You can also use MobileHandledException events in the crash event trail to aid in debugging. Use the iOS and Android recordHandledException APIs for iOS or Android to annotate where exceptions are handled in your application. These events will automatically appear in the crash event trail.
For more about annotating crash event trails with custom data, see Add custom data to mobile monitoring.
Use the event trail
To use the crash event trail:
- Go to one.newrelic.com > Mobile > (select a mobile app) > Crash analysis.
- On the lower right side of the Crash analysis page, select a crash type.
- On the Crash details page, beside the stack trace, select Event trail.
- Study the events leading up to a crash type for clues to the reasons for the crash.
- To expand details about an event's attributes, select it.
- To view the event trail results in New Relic, select Open session in Insights.
- To scroll through occurrences of the same crash type, use the event trail's left and right arrows.
To make the most out of our crash analysis tools, use:
- The Android SDK API or iOS SDK API to create custom
MobileBreadcrumborMobileHandledExceptionevents - Enable
MobileRequestevents - Crash analysis page
- Interaction trail
Difference between event trail and interaction trail
The crash event trail is different from the interaction trail. The crash event trail shows all mobile event types leading up to a crash, whereas the interaction trail only shows interaction event types (Mobile events with the category interaction). The interaction trail has additional features, including stack traces and links to the associated interaction charts.
