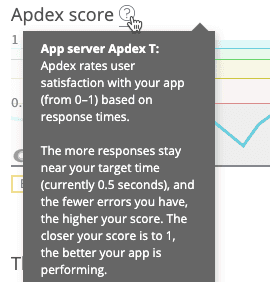
Your Apdex score measures users' satisfaction with the response time of your web applications and services. The dissatisfaction score is the difference between a perfect Apdex score (1.0) and your app's apdex_t ("tolerating") score based on your Apdex settings.
To help identify and troubleshoot Apdex level changes that indicate poor customer experiences with your site, use any of these resources:
- New Relic's user interface (explained in this document)
- New Relic REST API
- Alert notifications
Tip
Apdex applies only to web apps or services. The Apdex chart in the UI appears blank for non-web transactions. To get a high-level overview of all your applications and services, use the New Relic Explorer.
View Apdex score in APM
Apdex dissatisfaction levels of Tolerating (apdex_t) and Frustrated (apdex_f) indicate how slow site performance contributes to poor customer experiences in your app. For example:
- 1.0: All responses are satisfactory.
- Tolerating responses half satisfy a user. For example, if all responses are
Tolerating,then the Apdex score will be 0.50. - 0.0: None of the responses are satisfactory.
To view the Apdex score for your web apps or services:
- Go to one.newrelic.com > (select an app) > Summary.
- From the APM Summary page, review the Apdex score chart.
If you want to... | Do this... |
|---|---|
View your Apdex T value | Mouse over the Apdex icon. |
View summary information for any point in time on the chart | Mouse over the Apdex score chart. |
View detailed information about any point in time on the chart | Click or drag anywhere on the Apdex score chart. |
View the corresponding Apdex score for browsers | Select the Apdex chart's End user link. |
Go directly to detailed Apdex information | Go to one.newrelic.com > (select an app) > Transactions > See transactions table, and then sort by Apdex. |
View transactions with highest Apdex dissatisfaction
Transactions at the top of APM's Transactions page often are good candidates for performance tuning or fixing errors. To view transactions with the highest Apdex dissatisfaction percentage:
- Go to one.newrelic.com > APM > (select an app) > Transactions > See transactions table.
- Sort Apdex to find the most dissatisfying.
- Specific web transaction: To view details about a specific transaction, select its row.
By definition, the All transactions row always contributes 100% of the app's total dissatisfaction, even if no responses are dissatisfying (100% of zero is zero). In this situation, 100% does not mean that all of your transactions are dissatisfying. The sum of all the other values in this column is 100%.
To focus on Apdex levels for specific transactions, you can also:
- Configure transaction traces to capture
apdex_f, which is four times your app server'sapdex_t. - Create key transactions to track changes in Apdex values for specific transactions that are important to your business, such as signups, purchase confirmations, searches, site logins, etc.
View Apdex score in browser
Use browser monitoring to:
- Set Apdex levels for browser monitoring.
- Review Apdex levels from the perspective of real-user browser performance of your app.
- Track browser performance levels for selected countries you want to monitor.
Visualize Apdex data in query builder
Use query builder to:
- Create dashboards to analyze and share your Apdex data.
- Analyze your Apdex data with NRQL queries.
