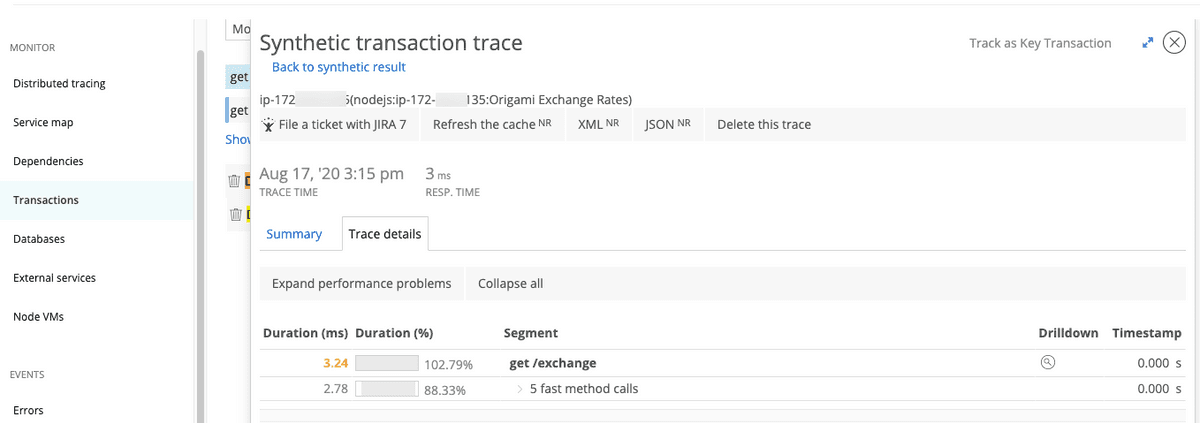
In APM, the Trace details tab shows the timing of individual segments in a transaction trace. This document describes the sections and features of the Trace details tab.
Trace details page functions
Go to one.newrelic.com > APM > (select an app) > Monitor > Transactions > (select a transaction trace) > Trace details.
The Trace details page displays a table with the timing data for the segments in a transaction, plus additional features and functions:
Trace details page | Description |
|---|---|
Primary trace data, functions | The top of each transaction trace UI page shows several primary pieces of data, including the trace time, response time, and, if available, CPU info. Also, sometimes the UI may indicate a partial trace. Available functions include:
|
Duration column | The duration of each segment and subsegment is shown as both the number of milliseconds and a percentage of the total transaction time. Especially slow segments are color-coded. |
Segment column | The Segment column displays segment names and counts. Fast and repeat calls may be automatically grouped together. Sometimes you may see Application code as the name of a segment or subsegment. To expand segments, use either of the following:
|
Drilldown column | The Drilldown column may contain icons that link to additional transaction data, if available. |
Timestamp column | The Timestamp column displays the start time of a segment or subsegment, relative to the start of the transaction. For example, a value of |
Drilldown options
In the Drilldown column, icons indicate that additional data is available:
Icon | Description |
|---|---|
The database icon links to the raw database query for that query segment. Depending on your transaction trace settings, this query can either show as raw data or obfuscated data. If the total time for the segment exceeds the query plan threshold in your settings, the query analysis also will appear, along with a stack trace showing the exact location of the call in your code. | |
The magnifying glass links to stack trace details. | |
This icon indicates that cross application tracing details are not available. However, you can select this icon to view aggregated transaction information across multiple invocations of the transaction. |
Examine logs for trace details
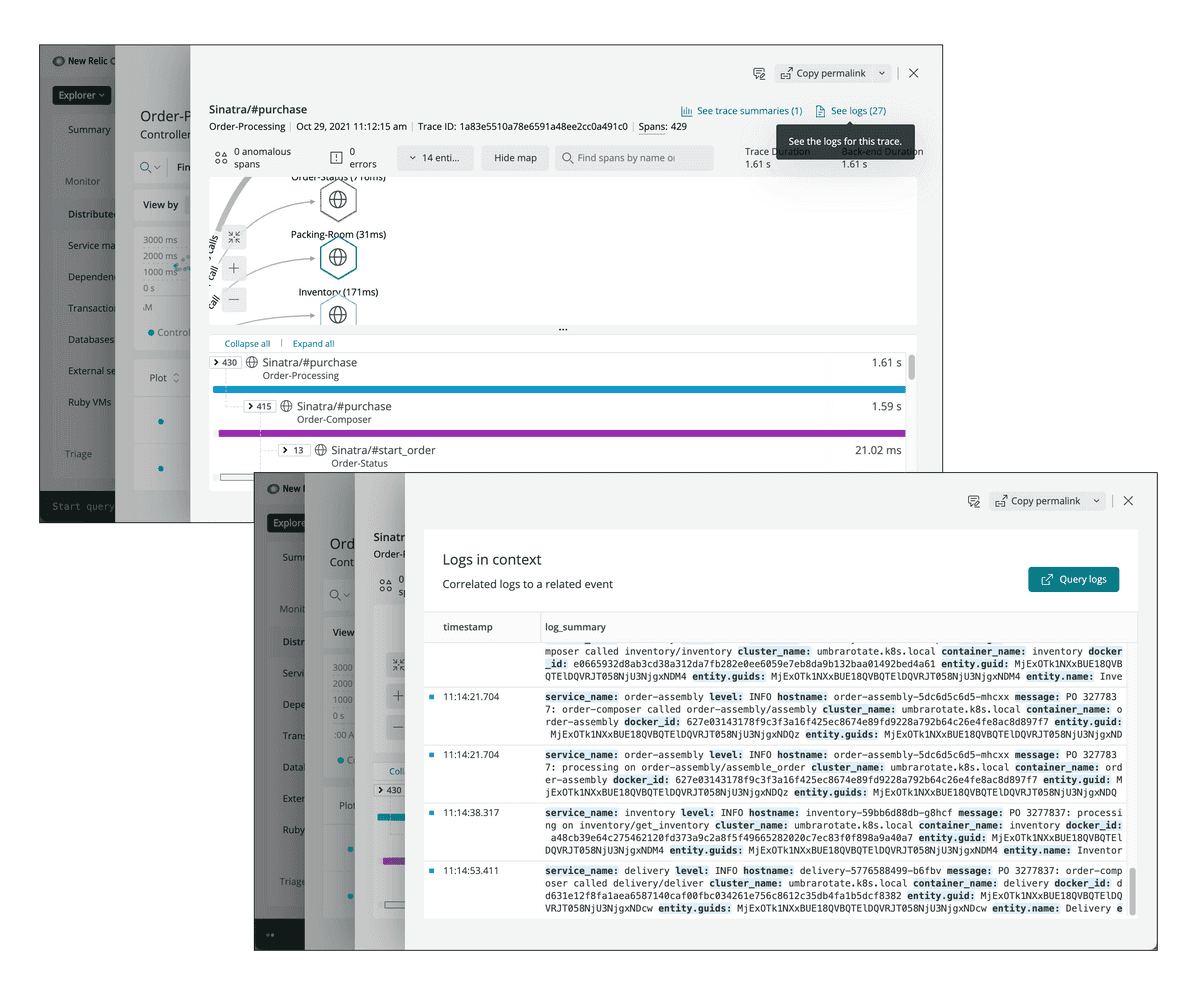
You can bring your logs and application's data together to make troubleshooting easier and faster. With logs in context, you can see log messages related to your errors and traces directly in your app's UI.
- From the Transactions page, click on a trace to go to the Trace details page.
- From the trace details page, click See logs.
- To view details related to an individual log message, click directly on the message.
With logs in context, you can examine log data directly within your trace details.
You can also see logs in context of your infrastructure data, such as Kubernetes clusters. No need to switch to another UI page in New Relic One.
Color coding of segment duration data
The Duration column of the Trace details table is color-coded:
![]() Red: More than 25% of the total transaction time was spent in this segment.
Red: More than 25% of the total transaction time was spent in this segment.
![]() Yellow: More than 5% of the total transaction time was spent in this segment.
Yellow: More than 5% of the total transaction time was spent in this segment.
Color-coded durations do not necessarily indicate a problem. Whether the timing is actually a problem depends on what you consider normal and acceptable for your application.
Application code in traces
If a segment is listed as Application code in the table, it indicates that that section of code was not instrumented. You can use custom instrumentation to get more detail on that part of the code. Segments will often be listed as Application code for partial traces.
Partial traces
For performance reasons, APM only captures the first 2,000 segments of a transaction trace (900 for Node.js). If a transaction trace exceeds that number of segments, the agent truncates the transaction trace and displays a message at the top of the Details page:
This is a partial trace.
The APM agents have differing rules for when to truncate segments.
APM agent | Truncate segment rules |
|---|---|
C SDK | Truncates based on segment priority:
|
Go | The segment duration must be greater than the |
Java, .NET, Ruby | These agents truncate traces chronologically. For more information, see the transaction tracer documentation for Java, .NET, or Ruby as applicable. |
Node.js | The Node.js agent only captures the first 900 segments of a transaction trace. For more information, see Node.js transaction tracer configuration. |
PHP | Truncates based on segment duration; the slowest 2,000 segments are captured for the trace. For more information, see PHP transaction tracer configuration. |
Python | Truncates based on segment duration; the slowest 2,000 segments are captured for the trace. For more information, see Python transaction tracer configuration. |
Segment grouping rules
Transaction traces that have a lot of segments can be hard to interpret. New Relic helps you by automatically grouping fast and/or repeated method calls into a single segment grouping.
For example, you might see a segment titled 7 fast method calls. This means that, because of their fast completion, New Relic assumed these calls were unlikely to be a problem and grouped them together. You can expand that grouping to see the individual segments.
Rules underlying segment grouping include:
- Fast calls: When New Relic detects four or more consecutive segments with a duration of 7.5 ms or less, these are grouped into a single collapsed header.
- Identical calls: When New Relic detects four or more consecutive identical calls, this usually indicates an N+1 problem. These segments are collapsed. Expanding the collapsed node displays only the first three calls, not all calls.

