When you report data to New Relic, we process what we receive and apply data dropping and transformation rules. Then we count the bytes needed to represent your data in a standard format, like JSON. If you're on our New Relic One pricing model, you're charged for the number of bytes written to our database that are above and beyond the free per-month amount.
If you're trying to estimate the cost of your data ingest, see Estimate data ingest.
Data ingestion UI
To learn how to easily analyze the data your account is ingesting, watch this short video (3:18 minutes).
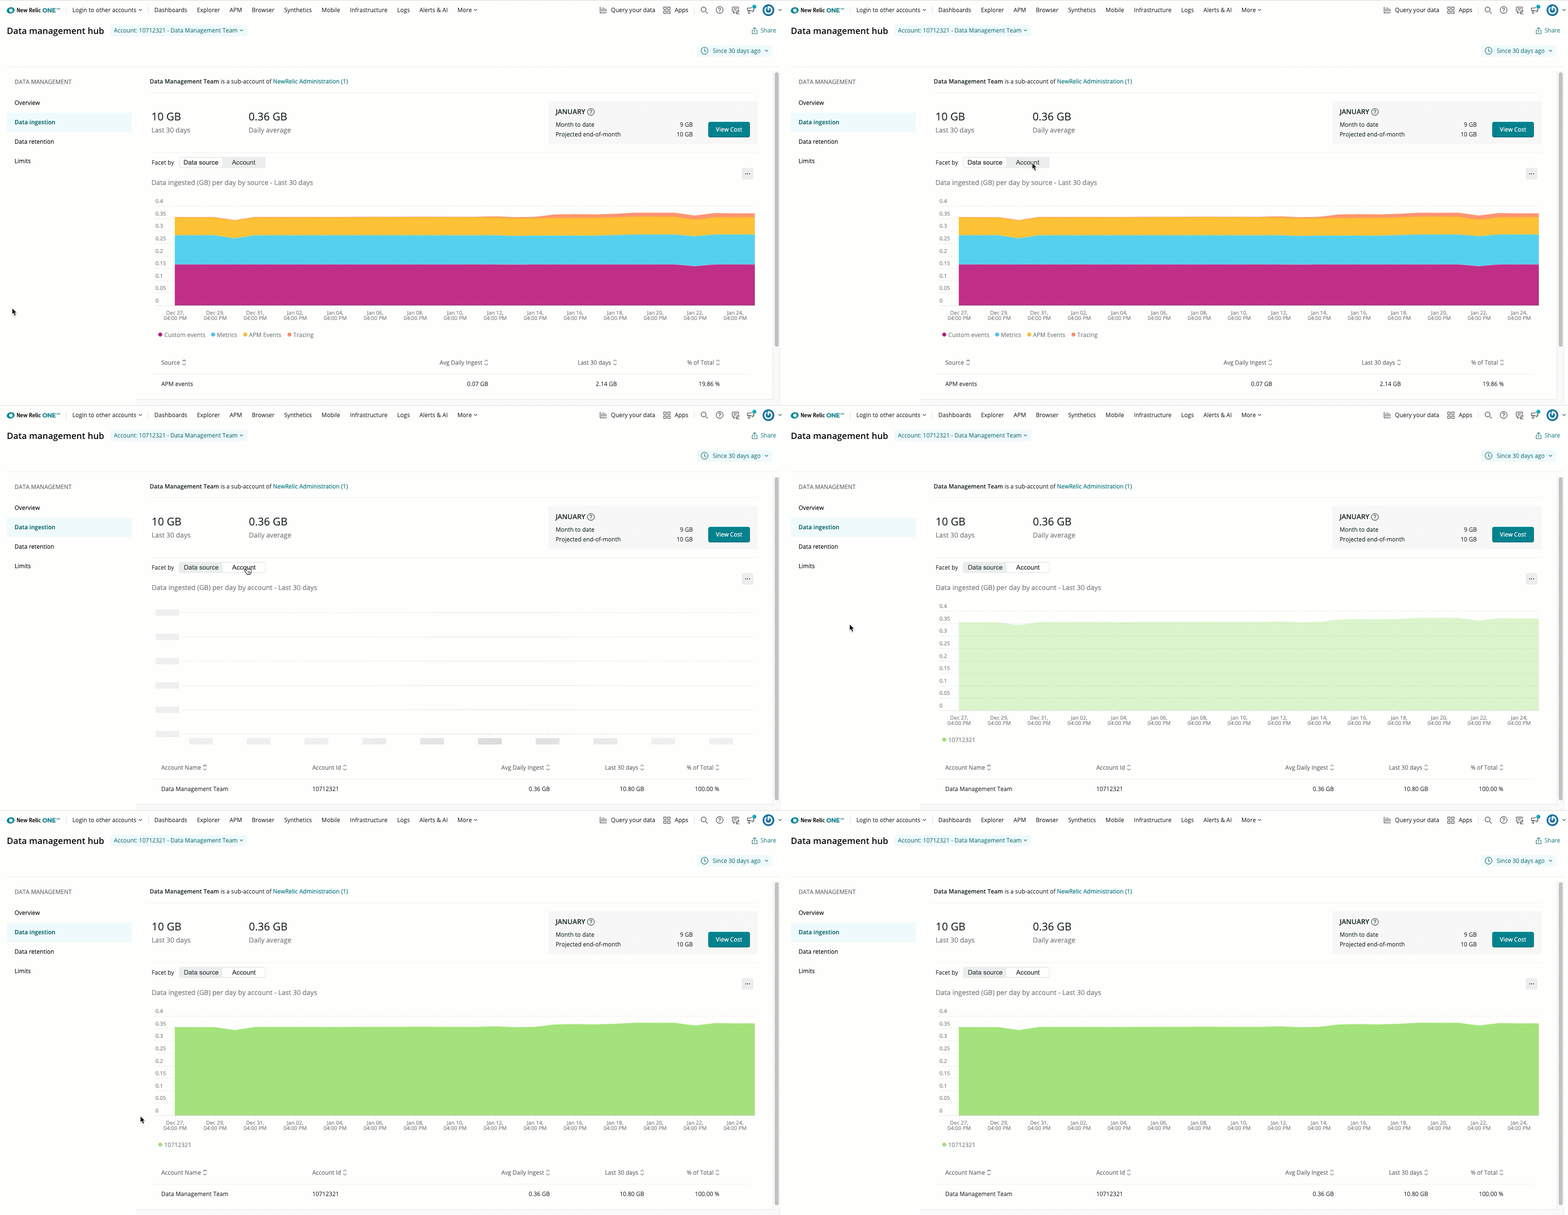
The Data ingestion tab is located in the Data management UI. The Data ingestion UI shows your ingest rates for the time period specified by the time picker in the upper right.
The page shows your daily average GBs, and the total GBs for that time range. You can toggle between an overall ingest view and an account view to identify which of your accounts are sending the most data. The page also provides the current month-to-date, and the projected end-of-month total ingest rates. With this information, you can proactively manage your data ingest in various ways.
To see the underlying NRQL query that is used to generate the chart, click View query.

From the account dropdown, select Manage your data, and then select Data ingestion.
Tip
For an advanced deep dive into managing data ingest in a complex organization see the data governance module of our observability maturity program.
For how to get more details about ingested data, see Get ingest details.
Data ingestion sources
The data ingestion UI chart shows you a high level breakdown of your billable data usage. The table below explains those sources. In this table, "usage metric group" refers to the value of that source's usageMetric attribute value on the NrConsumption event.
Data sources | Description |
|---|---|
Metrics | In the data ingestion chart, Metrics is a combination of two types of metrics: metric timeslice data and dimensional metrics. Usage metric group: Metric timeslice data averages to one-hour periods after eight days. After 90 days, the permanent metric data continues to be stored in one-hour periods. We currently store the raw metric data for 30 days. You are only billed for the initial ingest volume. You are not billed for subsequent rollups. |
APM | This includes APM events, like Usage metric group: |
Infrastructure | Includes several categories of infrastructure monitoring events, described below. |
Infrastructure host data. Usage metric group: Information related to your servers and virtual machines coming from infrastructure agents, including storage and network data. | |
Infrastructure process data stored in Usage metric group: Data related to each process running on the hosts running the infrastructure agent. This feature is turned off by default. For more information, see Process metrics. | |
Infrastructure integrations. Usage metric group: Performance data related to applications and services, typically managed by the customer, including data related to Docker containers, Windows services, Nagios checks, and cloud integrations such as managed services in AWS, Azure, and GCP. | |
Logging | Includes logs and any Usage metric group: Log records are stored on the With As of September 2021, log storage as blobs replaces |
Default | Usage metric group: |
Mobile events | Mobile events, including the general Usage metric group: |
Tracing | Usage metric group: |
Browser events | Browser events, including the namespaces of Usage metric group: |
Lambda | Usage metric group: |
Understand where data is coming from
You can inspect your data ingest to gain more information about your ingest health.
From the data ingestion UI page, you can analyze your usage in more detail. Spending some time understanding your ingested data and where it comes from and how it changes over time can be valuable. You'll know your ingest baselines, and you'll be able to more easily spot anomalies, like ingest spikes, and understand their source.
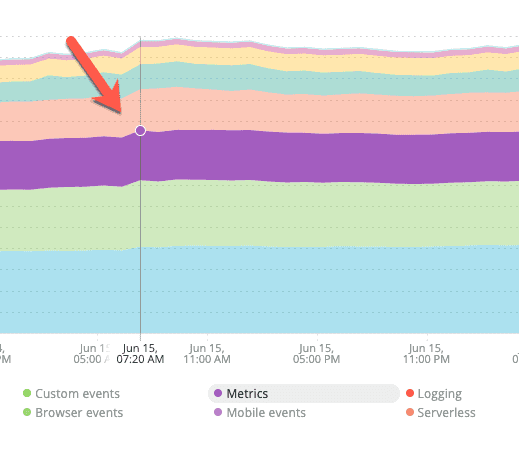
On the data ingestion chart, time is on the X axis and the bands representing data sources are located along the Y axis. Click on a data source band you want to inspect at the spot in the X axis that corresponds with the date you want to investigate.
This image shows the data source band for June 15 right before it's clicked.
A modal opens with the account, data source, and facet selected. You can do a handful of things on this page:
- Change the account, data source, or facet you want to drill down into.
- Change the time range.
- Review the results of the query in chart form. The chart displays the top 15 results for the facet query.
- Open the NRQL query in the Query builder where you'll find additional facets that you can use.
For more about creating more detailed queries:
- Learn some NRQL basics.
- See some example usage-related queries.
How ingested data is broken down
Some of the usage data in this UI can vary depending on your account. This information is intended to help you understand how we're working with your ingest data:
- The chart on the Data ingestion page shows data usage for a little longer time frame than that covered by your retention settings for each data ingest source. If you choose a date outside of your designated retention period for an ingest source, you'll get the message that there's no chart data available. Select a more recent date to fix this problem.
- If you inspect a data source for an account that has less than a terrabyte of data, we compute the ingest volume over a 24 hour period; otherwise, we compute it for a one hour period.
- The ingest value provided on the main Data ingestion chart will be slightly different from that reflected during inspection. This is because our facet computation is an estimate.
Set alerts for data use
For how to set alerts that will notify you when you're reaching data ingest levels you don't want to cross, see Query and alert on usage data. For example, you might set an alert on logs, which can accumulate quickly in an active system.
Adjust your data ingest
Here are some ideas for managing your data:
Drop unwanted data
On ingest, we apply data dropping rules so you won't be charged for data that's not useful. Learn how to set additional data dropping rules yourself. For how to drop log data, see Drop log data.
Disable agents and integrations
If you have agents or integrations that you don't need at all, you can uninstall/delete those tools. For instructions, see the specific docs for that tool.
Adjust APM data ingest
Options for adjusting APM data include:
- Configure the sampling rate for transaction events.
- Set appropriate Apdex scores, for example, for frequency of traces.
- Optimize custom instrumentation and/or custom metrics.
Adjust infrastructure data ingest
Options for adjusting infrastructure data include:
- Adjust sampling rate for network, storage, and system events.
- Disable process metrics.
- Adjust polling intervals:
- Polling for cloud integrations.
- For on-host integrations: edit the configuration file for a specific integration.
- Control the reporting of specific attributes.
- Manage Kubernetes events integration.
Adjust log data ingest
Options for adjusting log data ingest include:
- Use the log forwarder to filter log events on the sending side.
- Drop log data, either via the UI or with NerdGraph.
