The integration of APM and infrastructure data lets you see your APM data and infrastructure data side by side so you can find the root cause of problems more quickly.
The main ways to find and use APM data in infrastructure monitoring are:
- View APM charts on infrastructure monitoring UI pages
- Filter hosts by application data
- Switch between infrastructure and APM
- Examine APM data in Inventory and Events pages
Infrastructure data appears in APM in the host table on the APM Summary page.
View logs for your APM and infrastructure data
You can also bring your logs and application's data together to make troubleshooting easier and faster. With logs in context, you can see log messages related to your errors and traces directly in your app's UI. You can also see logs in context of your infrastructure data, such as Kubernetes clusters. No need to switch to another UI page in New Relic One.
How to integrate APM and infrastructure data
For APM and infrastructure data to be integrated, all of the following must be true:
- The APM agent and the infrastructure agent must be installed on the same host.
- Both agents must use the same New Relic license key.
- They must use the same hostname.
If the integration is not working, see Troubleshooting the APM-Infrastructure integration.
View APM charts
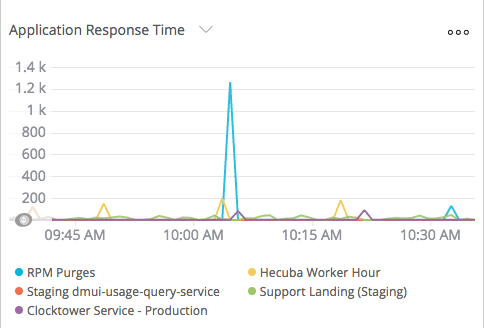
When your APM and infrastructure data is linked, you have access to APM data charts on these Infrastructure monitoring UI pages: Hosts, Network, Storage, and Processes.
To switch to different charts: select the dropdown beside a chart's name and choose a new chart. Application-related charts will be near the top.
one.newrelic.com > Infrastructure > Hosts: If your APM and Infrastructure data is linked, the charts in Infrastructure monitoring can be changed to show your application data.
Filter by application data
When your APM and infrastructure data is linked, you can filter displayed host data using Applications:
From the host filter, select Applications.
Select the application you want to filter on.
Tip
On the Hosts page, you can also filter by selecting items in the Applications column.
Switch between infrastructure and APM
When your APM and infrastructure accounts are linked, you can switch over from infrastructure to APM and vice versa for the same selected time range.
You can switch from infrastructure to APM from these locations:
- From the host filter Applications menu
- On the Hosts page, when selecting applications in the Applications table column.
You can switch from APM to infrastructure from the host table on the APM Summary page.
APM data in Inventory and Events
When your APM and infrastructure data is linked, you can view and filter on application data on the Infrastructure monitoring UI's Inventory page and the Events page.
View host data in APM
When your APM and infrastructure data is linked, you have more available host data in APM.
The APM Summary page contains a table with data about your app's hosts and instances, including:
- Apdex
- Response time
- Throughput
- Error rate
- CPU usage
- Memory
You can toggle between a table view or breakout metric details for the individual hosts by selecting View table or Break out each metric by host.
For more information on host data on the APM Summary page, see host details.
Troubleshoot missing APM data
APM/Infrastructure integration should happen automatically if you have both the APM agent and the infrastructure agent installed on the same host(s) and they use the same New Relic license key and have the same hostname set. If you do not see APM data in infrastructure monitoring, see Troubleshooting.
