Enabling New Relic's logs in context correlates your log data with data collected from our APM and infrastructure agents. This means that you'll see logs data or links to log data in other UI experiences, such as APM, infrastructure monitoring, distributed tracing, and errors inbox. You can use that log data to dig deeper into the performance of your app or host, without needing to manually search through log data.
To see how logs in context and log patterns can help you find the root cause of an issue, watch this short video (approx. 5 minutes):
See the root cause of issues across your platform
By bringing all of your application and infrastructure data together in a single solution, you can get to the root cause of issues faster. Logs in context help you quickly see meaningful patterns and trends.
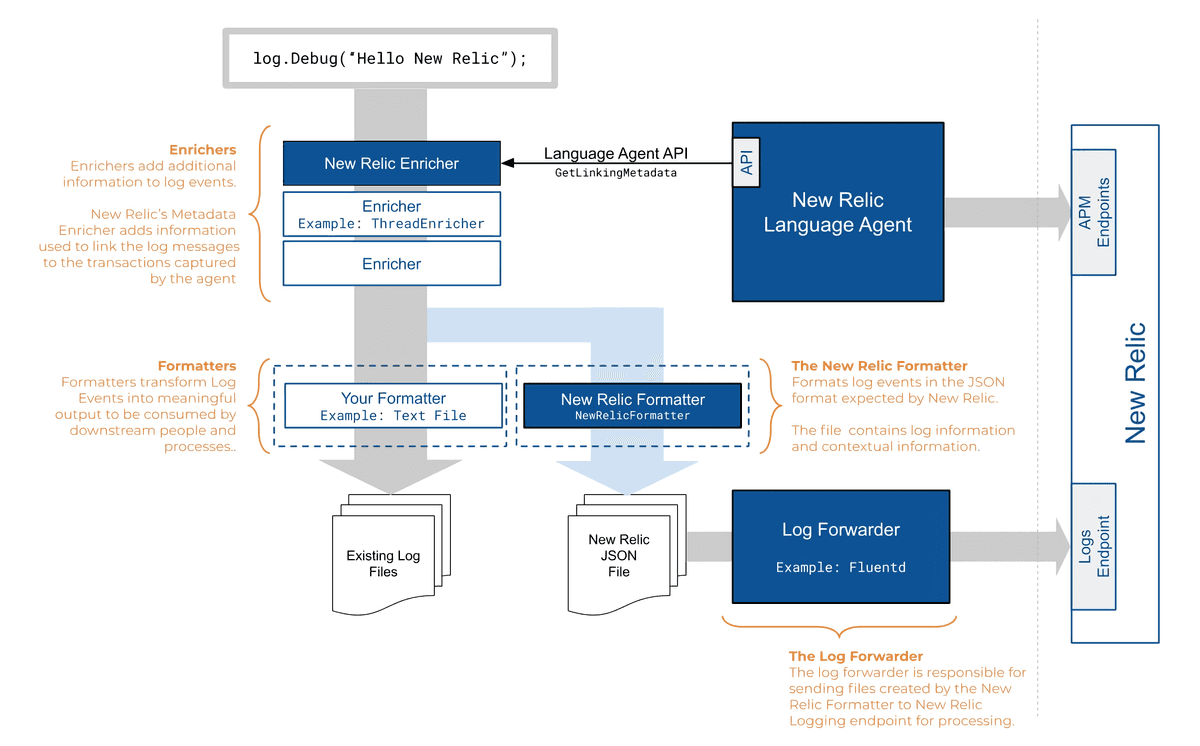
The following diagram shows the lifecycle of a log message, from enrichment with agent metadata (contextual logging), to formatting and forwarding the log data to New Relic:
This diagram illustrates the flow of log messages through New Relic.
Don't spend extra time trying to narrow down all your logs from different parts of your platform. Instead, enable logs in context to see the exact log lines you need to identify and resolve a problem.
Basic process to enable logs in context
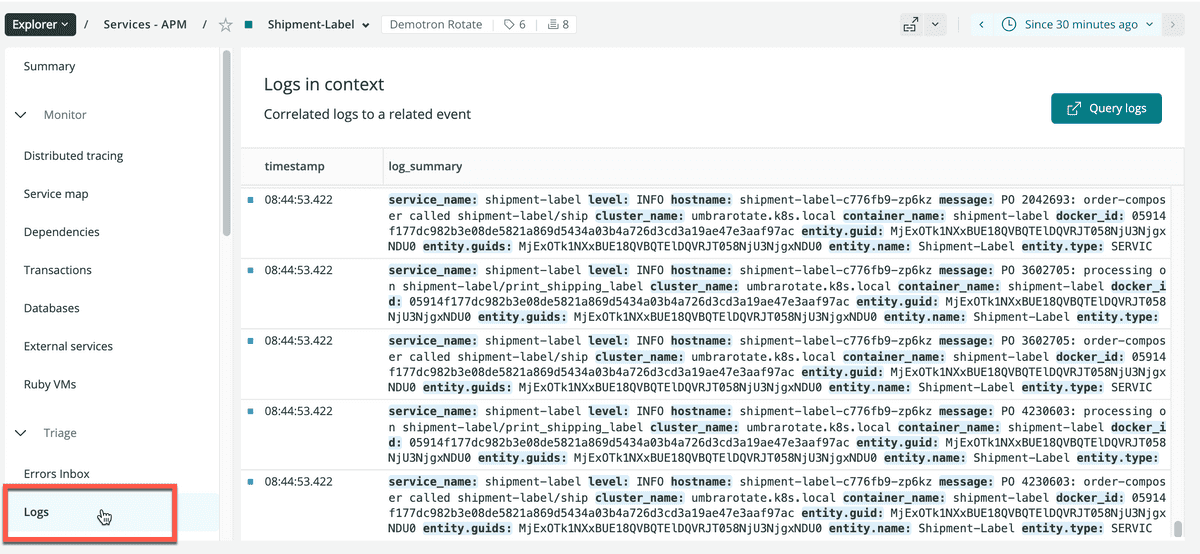
Here's an example of the New Relic APM UI showing logs in context. You can see logs in context of events for the selected time period, and drill down into detailed data for any of the highlighted attributes. To take advantage of even more capabilities, click Query logs from here to go directly to the Logs UI.
Here's how to set up logs in context for APM and for infrastructure monitoring:
- Make sure you have already set up logging in New Relic. This includes configuring a supported log forwarder that collects your application logs and extends the metadata that is forwarded to New Relic.
- If you want logs in context for APM: first update to a supported APM agent version, and enable distributed tracing. For specific instructions, select your agent:
- If you want logs in context for infrastructure monitoring, see enable logs in context for the infrastructure agent.
- See logs data in context with your monitored apps and hosts.
API and other options
If our logging solutions don't meet your needs, you can use other options to send your log data to New Relic:
- Logging extensions via agent API calls
- HTTP endpoint via our Log API
- Syslog protocols via TCP endpoint (useful for CDNs, hardware devices, or managed services)
What's next?
After you set up logs in context for APM or infrastructuring monitoring, make the most of your logging data in the New Relic One UI:
- Explore the logging data across your platform with our Logs UI.
- See your logs in context of your app's performance in the APM UI. Troubleshoot errors with distributed tracing, stack traces, application logs, and more.
- Get deeper visibility into both your application and your platform performance data by forwarding your logs with our infrastructure monitoring agent. Review your infrastructure logs in the UI.
- Set up alerts.
- Query your data and create dashboards.
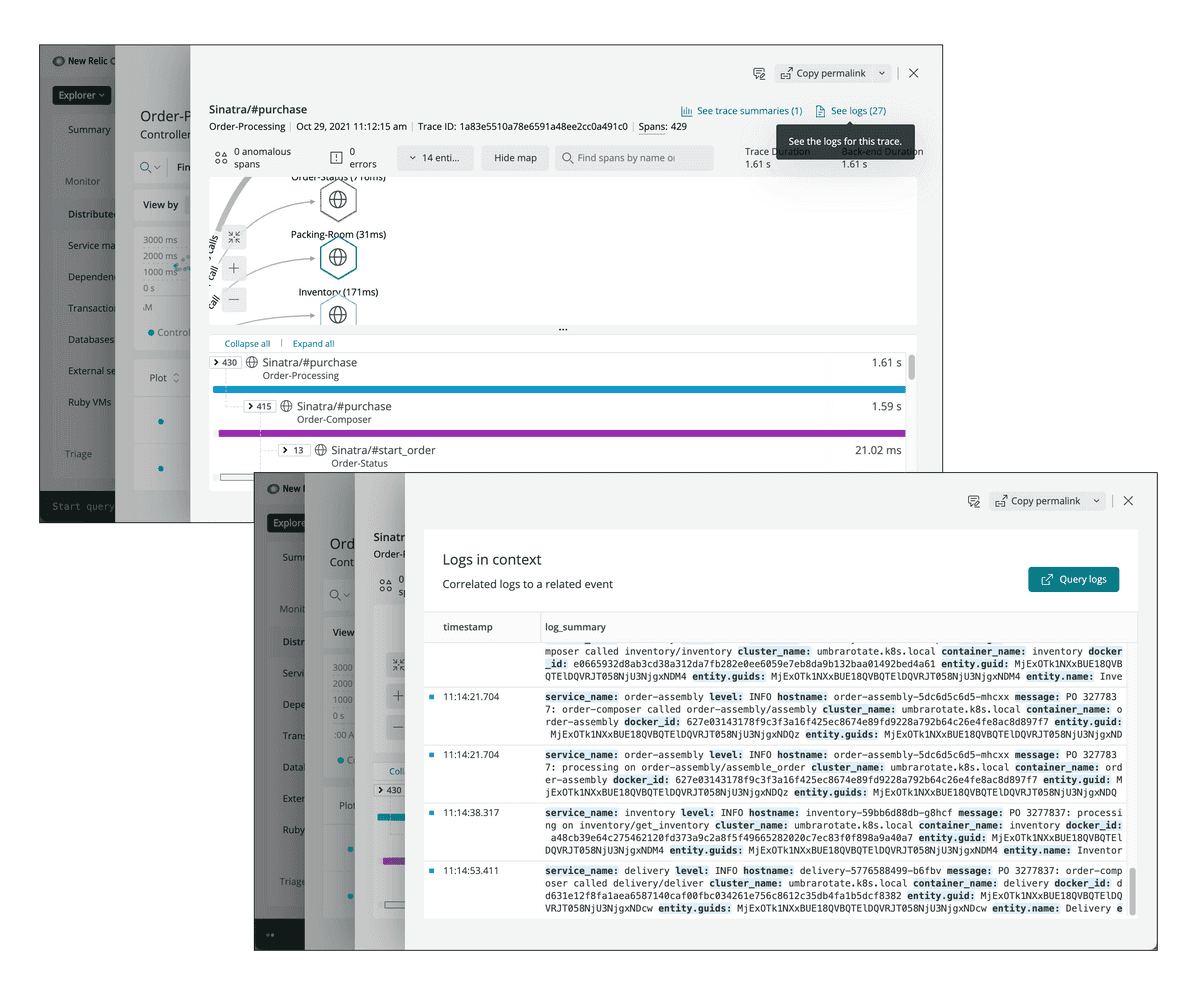
Here is an example of logs in context for app trace details, visible from the APM UI.


