Here are some best practices based on how OpenTelemetry works with New Relic:
Tip
For information about resolving specific issues, see our troubleshooting guide.
Resources
A resource in OpenTelemetry represents information about an entity generating telemetry data. All telemetry data sent to New Relic is expected to be associated with a resource so that it can be linked with the appropriate entity in New Relic. The OpenTelemetry Resource SDK specification defines the functionality implemented by all language SDKs for defining a resource.
The following suites of attributes are defined by the OpenTelemetry resource semantic conventions. These attributes are usually set by creating a resource using the OpenTelemetry SDK.
service.* attributesservice.nameattribute is required to associate your resource with an entity in the UIservice.instance.idis required for certain panes to light up
telemetry.sdk.language=javais required to see data in the JVM section
Batching
Caution
To avoid getting rate limited, we recommend these practices:
- Batch requests sent to the OTLP endpoint as described in this section
- Explicitly enable gzip compression
- Ensure your attribute lengths don't exceed New Relic maximums
By default, the OpenTelemetry SDKs and Collector send one (1) data point per request. Using these defaults, it is likely your account will be rate limited.
All OpenTelemetry SDKs and Collectors provide a BatchProcessor, which batches data points in memory. This batching allows requests to be sent with more than one (1) data point.
Component | Batch Processor |
|---|---|
Collector | |
Go SDK | |
JS SDK | |
Python SDK |
Compression
New Relic supports gzip compression for OTLP payloads transported via gRPC or HTTP. The maximum allowed payload size is 1MB (10^6 bytes). To maximize the amount of data you can send per request, we recommend enabling compression in all OTLP exporters. If there are other compression formats you'd like to see us support, please let us know in the CNCF Slack channel.
Attribute lengths
New Relic's limits on attributes apply to data from any source, including OTLP-sourced data. See metric attribute limits and event attribute limits for other limits:
- Length of attribute name: 255 characters
- Length of attribute value: 4096 maximum character length
If a span attribute is the offender, you can use span limits environment variables to configure the maximum length(s). If a resource attribute is the offender, you can set OTEL_RESOURCE_ATTRIBUTES=<offending-attribute>=unset to override it.
Not all language SDKs support the span limits environment variables, so it depends on which language you are using. If your language doesn't support these, we recommend that you open a Github issue for it in the respective language SDK repo so that the OpenTelemetry community can resolve it.
Traces
Familiarize yourself with these trace topics to ensure your traces and spans appear in New Relic.
Required fields
The startTimeUnixNano and endTimeUnixNano fields on spans are required according to the OpenTelemetry protocol for trace data. When startTimeUnixNano is not present, the span is dropped and a NrIntegrationError is created. When endTimeUnixNano is not present, the duration of your span is large and negative.
The timeUnixNano field on span events is required. When timeUnixNano is not present, the span event is dropped and a NrIntegrationError is created.
The traceId and spanId fields on spans are required according to the OpenTelemetry protocol for trace data. When traceId or spanId are not present, the span is dropped and a NrIntegrationError is created.
Sampling
Trace data is the most mature OpenTelemetry data type. Because of this, New Relic's OpenTelemetry user experience is largely based on trace data and is therefore influenced by your sampling strategy.
You can configure sampling in a number of places:
- Service: Use the OpenTelemetry SDK for your language.
- Collector: If you're running your own instance of the OpenTelemetry collector, you can configure it to do more sophisticated forms of sampling, such as tail-based sampling (see below).
Check out this documentation about how to configure different types of sampling:
Metrics
OpenTelemetry metrics are largely compatible with New Relic dimensional metrics. We support OpenTelemetry metrics v0.10. All of the supported metric types include an independent set of associated attributes (name-value pairs) which map directly to dimensions you can use to facet or filter metric data at query time. OpenTelemetry metrics are accompanied by a set of resource attributes that identify the originating entity that produced them and map to dimensions for faceting and filtering.
The OpenTelemetry data model for metrics defines a number of different metric types: sum, gauge, histogram, and summary.
Sum metrics
OpenTelemetry sums are a scalar metric that is the sum of all data points over a given time window. Sums have a notion of temporality indicating whether reported values incorporate previous measurements (cumulative temporality) or not (delta temporality).
In addition, sums can either be monotonic (only go up or only go down) or non-monotonic (go up and down).
Delta sums
In New Relic, delta metrics are handled differently depending on whether they are monotonic or non-monotonic:
- Monotonic delta sums are mapped to the count metric type.
- Non-monotonic delta sums are mapped to the gauge metric type.
Cumulative sums
Monotonic and non-monotonic cumulative sums are mapped to the New Relic gauge metric type.
Sum configuration examples
To understand how to configure aggregation temporality, see these examples using the Java and Go OpenTelemetry SDKs.
Gauge metrics
OpenTelemetry gauge metric data points represent a sampled value at a given time. These values are converted to the New Relic gauge metric type. OpenTelemetry gauges do not have an aggregation temporality, but the sampled values can be aggregated at query time.
Histogram metrics
OpenTelemetry histograms compactly represent a population of recorded values along with a total count and sum. Optionally, histograms may include a series of buckets with explicit bounds and a count value for that bucket's population.
Caution
New Relic doesn't currently support cumulative histograms. Instead, convert your cumulative histograms to delta temporality.
Before configuring your SDK to use delta temporality, see the specification for the OTLP metric exporter.
You can use this account query to determine if metrics are being dropped due to unsupported temporality:
FROM NrIntegrationError SELECT * WHERE message = 'One or more OTLP metric data point(s) were dropped due to unsupported AggregationTemporality.'OpenTelemetry histograms are converted to New Relic’s distribution metric type, which is backed by a scaled exponential base 2 histogram (see NrSketch for a more thorough explanation).
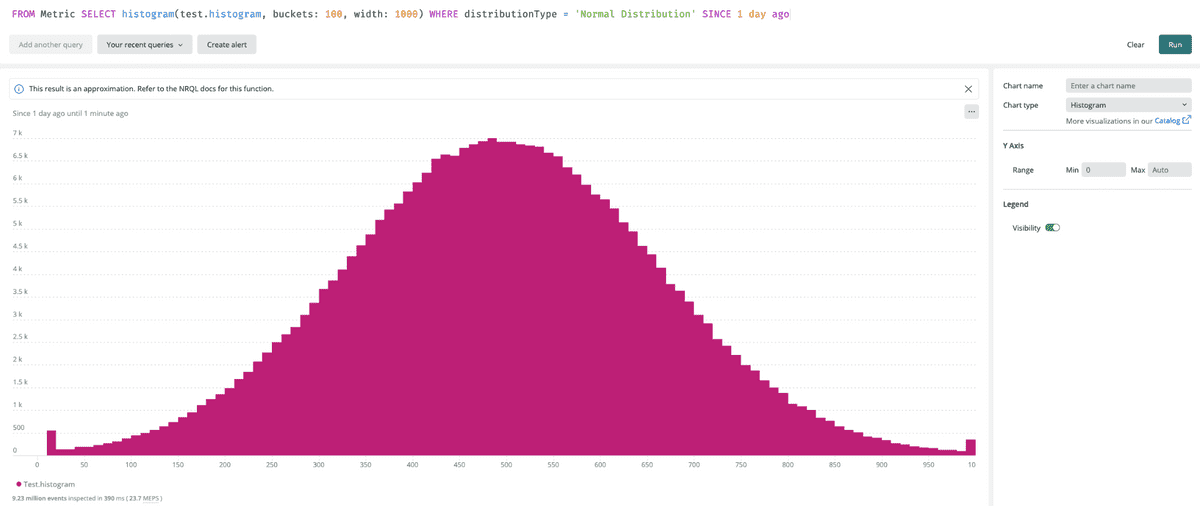
Counts from OpenTelemetry histogram buckets are assigned to New Relic’s distribution metric buckets using linear interpolation. Also, OpenTelemetry has negative and positive infinity bound buckets which we represent in New Relic as zero-width buckets. We do this because we do not have a representation for negative and positive infinity. For example, an OpenTelemetry bucket with bounds [-∞, 10) will be represented by a [10,10) zero width New Relic bucket. You may see exaggerated bucket counts at the endpoints of your distribution due to this translation.
Summary metrics
OpenTelemetry summary metric data points are used to represent quantile summaries (for example, P99 latency). These map directly to the New Relic summary metric type.
Summary metric data points include count, sum, and quantile values, with 0.0 as min and 1.0 as max. OpenTelemetry provides summary metrics for compatibility with other formats.
Start time
The startTimeUnixNano field is optional according to the OpenTelemetry specification. When this field is provided, it is used for the timestamp on the resulting NewRelic metric, and the duration is calculated as timeUnixNano - startTimeUnixNano. The duration field is used to calculate the queryable endTimeStamp attribute on the New Relic metric, but it serves no other semantic purpose.
If startTimeUnixNano is not provided, then timeUnixNano is used for the timestamp field on the resulting NewRelic metric, and the duration field is set to zero.
Array values for attributes
OpenTelemetry metrics and other signals may include attributes that consist of a homogenous array of primitive types. New Relic supports non-nested homogeneous arrays with less than 65 elements.
Exemplars
OpenTelemetry defines exemplar values that allow other signals, like traces, to be connected to a metric event and provide context. Exemplars are not supported by New Relic.
How to query metrics
Consider these tips for building metric NRQL queries in New Relic.
Query cumulative sums stored as gauges
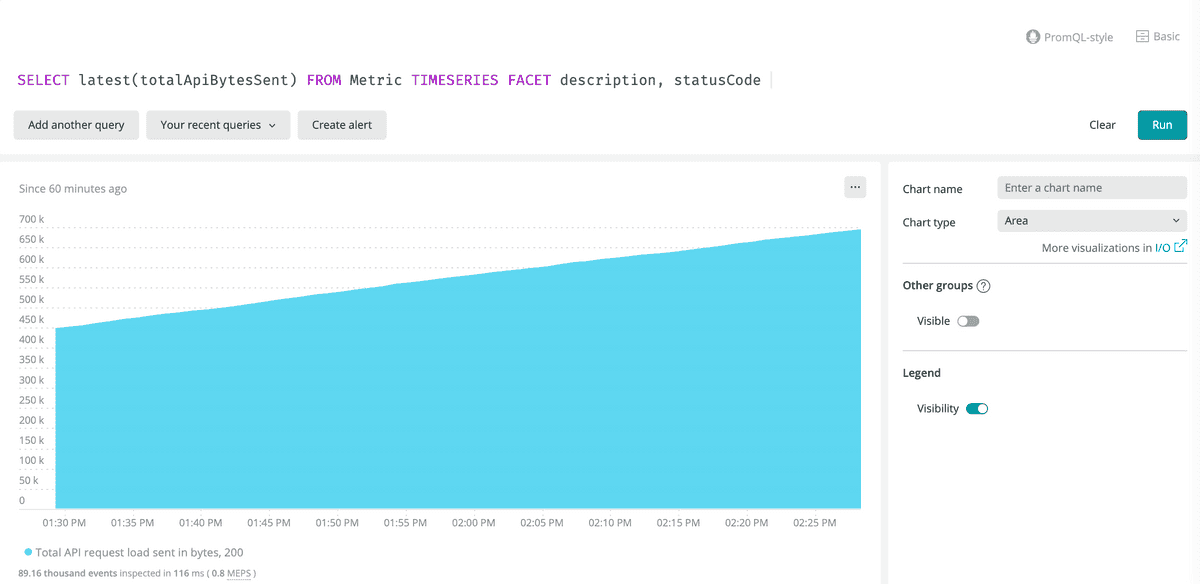
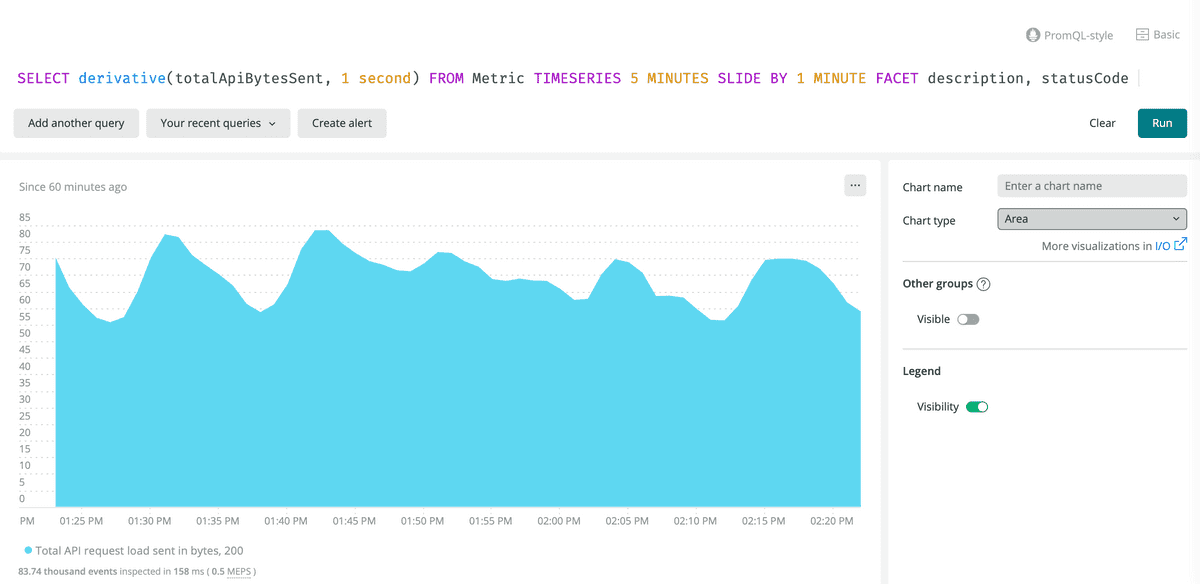
Since cumulative sums are converted to gauges, here are some ways to query your data:
Query gauge metrics
When New Relic converts cumulative sums to gauges, you can query them using either the latest() or derivative() NRQL functions. The function you choose depends on whether you want to see the raw value or compute the rate of change.
Query histogram metrics
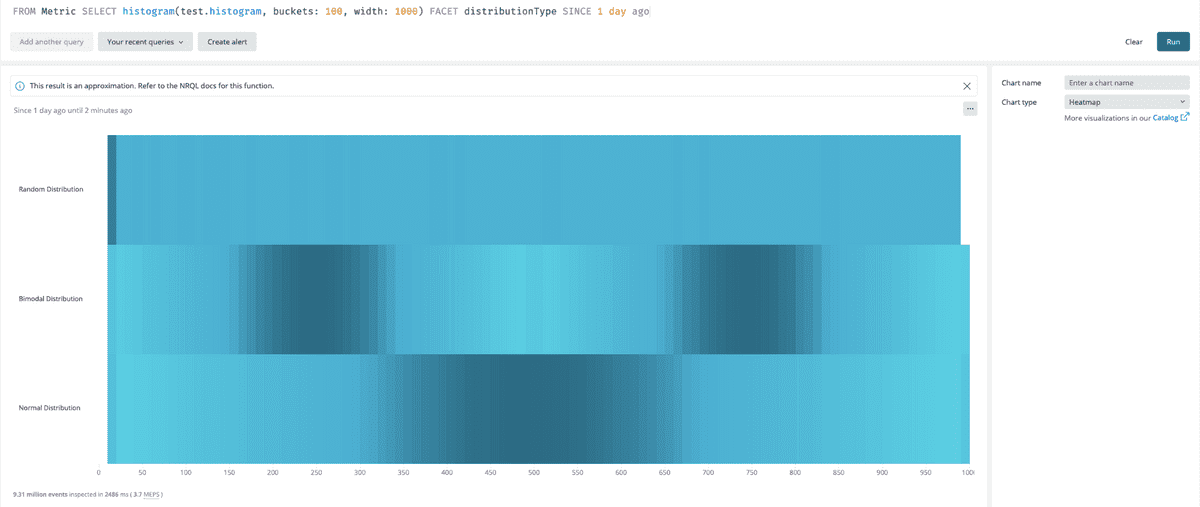
New Relic histograms translated from OpenTelemetry metrics have the same query semantics as other New Relic histograms. Namely, the histogram() NRQL function can be used to represent the histogram with a configurable number of buckets and bucket width. Note that you may see larger bucket counts at the endpoint buckets. This is because we are adding negative and positive infinity bound OpenTelemetry buckets into a zero width New Relic bucket.
Important
The TIMESERIES keyword is not supported for New Relic histograms.
Logs
Logs generated from your applications and environment are an important piece of telemetry. They may represent application logs, machine generated events, or system logs. OpenTelemetry has defined a log data model for representing log data.
You can send logs using OpenTelemetry tooling, correlate them with applications, and view them in New Relic.
Send logs to New Relic
The OpenTelemetry Collector and OpenTelemetry Collector Contrib repositories contain a number of components for consuming log data. The general pattern is to configure the collector to:
- Receive logs from any of the log receivers. Some of the receiver options include Filelog Receiver, Fluent Forward Receiver, and Syslog Receiver.
- Process logs, potentially annotating them with resource information. Some of the processor options include Resource Detection Processor and Resource Processor.
- Export logs to New Relic via the OTLP exporter.
Application log correlation
Application logs are more useful if they're correlated with other telemetry data produced by the application. The OpenTelemetry semantic convention for services specifies service.name as a required field. All application metric, trace, and log data sent to New Relic with the same service.name are associated with the same entity.
The specifics of how logs get annotated with the service.name resource attribute depends on the application's environment:
- Applications may produce structured JSON logs, which you can configure to include
service.nameas another field. - You can deploy applications alongside a dedicated Collector Agent instance, which you can configure with a Resource Processor to annotate logs with the
service.nameattribute.
Optionally, additional application trace context (sometimes called execution context) can be propagated to log messages. The setup and availability of this depends on the language and logging framework used by the application. The general strategy is to set up the application to write structured JSON logs and to configure it to extract trace context into specified trace context fields on available log messages.
The Logs in Context with Log4j2 example in GitHub demonstrates an end-to-end working example for a simple Java application using Log4j2.
View OpenTelemetry logs
Here are two ways you can view logs:
- Look in the New Relic Logs UI.
- If your logs are correlated with an application, view them in the context of the application.
The time field
The timeUnixNano field is optional according to the OpenTelemetry specification for log data. When timeUnixNano is not present New Relic will use the time that the data was received for the New Relic log timestamp.


