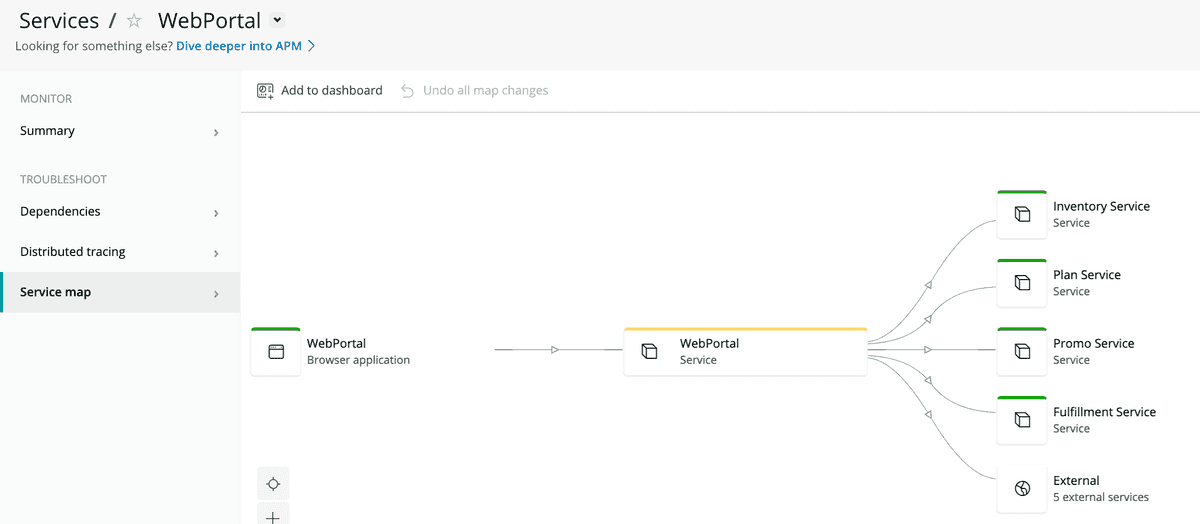
Service maps are visual, customizable representations of your architecture. Maps automatically show your app's connections and dependencies, including applications, databases, hosts, servers, and out-of-process services.
Tip
In the New Relic UI, your out-of-process services are referred to as web external or background external data.
Health indicators and performance metrics show you the current operational status for every part of your architecture.
Service maps help you:
- Understand how apps and services in your architecture connect and communicate.
- Quickly see the current health and operational state of your entire environment.
- Troubleshoot operational issues and understand the impact of problems down to the host and instance level.
- Collaborate and drive shared understanding of an architecture.
Access service maps
Two options are available in New Relic One: the current service maps and the legacy APM service maps. To access the different service maps:
Type | To view maps | Purpose |
|---|---|---|
Go to one.newrelic.com > Explorer > (select an entity) > Monitor > Service map | Service maps give you increased access to all the entities across your accounts, and help you understand how your entire environment is connected. | |
Go to one.newrelic.com > More > Service maps | Legacy APM service maps let you create, customize, and share maps related to an individual app. |
Identify operational issues
Service maps are color-coded to provide a quick look at the current status of your environment. Select nodes on a map to view additional performance metrics, and a full list and health check of each node's connections.
The map automatically connects nodes into the map, so you can see which apps on the map connect to others. This helps you troubleshoot and assess the impact of a performance problem between a calling application and a specific database.
With service maps, you can view your service and its status in the context of its up and downstream dependencies. Use maps in New Relic One to identify the root cause when troubleshooting an incident.
Check out How to use service maps for details about these topics:
- View all your entities without any setup: most entities are automatically connected to their dependencies in service maps.
- View entities all across your organization's accounts.
- Add a map to a dashboard.
one.newrelic.com > Explorer > (select an entity) > Monitor > Service map: Service maps show your dependencies and how they're performing.
