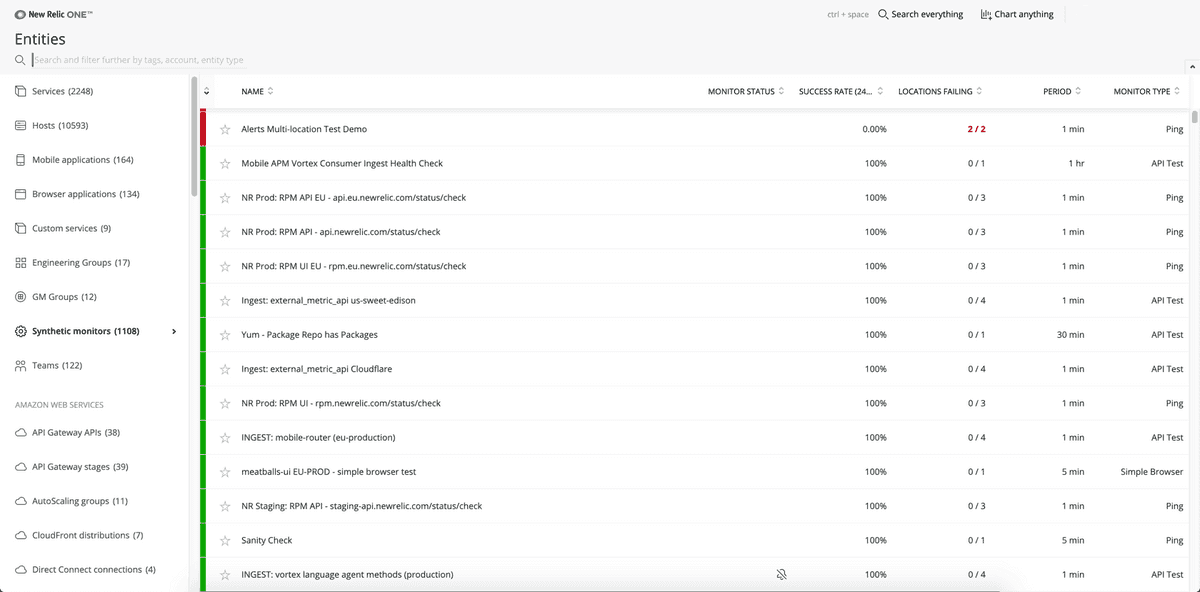
Synthetic monitoring automatically records all ping monitor checks, allowing you to see the load time and response size for every run.
Use the explorer and the selected ping monitor's Summary and Results pages to:
- Select a resource to view load timing, response and request headers, and other details.
- Use these details to find problems and diagnose performance issues.
Tip
For information on simple or scripted monitors, see View simple or scripted monitor results.
View ping monitor results
To access a complete list of ping monitor results:
- Go to one.newrelic.com > Explorer > Synthetic monitors.
- To find the type of result you're looking for, sort using the provided filters. For example, to view all ping monitors, sort by Monitor Type. You can also search for specific results using the New Relic One quick find, which is available across the New Relic One platform.
- To view specific information about a monitor, such as page load time and availability, select a ping monitor to access the selected monitor's Summary and Results pages.
one.newrelic.com > Explorer > Synthetic monitors > (select a monitor): View a summary of the selected ping monitor including load time and total load size.
If you want to... | Do this... |
|---|---|
Get details about page resources | Click on a specific ping monitor check to access Result Details view. From the Result Detail view, you can:
|
View transaction traces |
|
Share a result | Copy the unique URL from your browser's address bar; for example: You can then share this URL with anyone else who has access to your New Relic account data. |
Quickly access another monitor |
|
Timing details
For some monitor types, the overall monitor check duration will be larger than the individual page request durations. This is because some browser behaviors are not measured individually but still count towards the total check time.
Examples of unmeasured behaviors include:
- JavaScript interactions
- Resource pre-fetching and prioritization
- DNS pre-resolve
- TCP pre-connect
- Page pre-rendering
