APM's Transactions page helps you identify transactions that may be good candidates for fine-tuning performance problems or resolving errors. This page lists the selected app's transaction Requests, the top five transactions by percent of wall-clock time, and relevant throughputs (requests per minute or rpm).
For non-web transactions (such as message processing, background tasks, and other processes and jobs that do not handle web requests), this page shows charts of CPU and memory usage.
Types of transactions
Tip
To get a high-level overview of all your applications and services, use the New Relic Explorer.
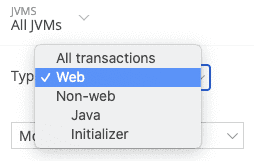
Depending on your selected application, the Transactions page may include a dropdown you can use to select from the types of transactions available. New Relic measures processing time by type of request (web transaction or non-web transaction). This may include:
- Web: App server requests
- Non-web: Other requests (operations, background tasks, etc.)
The Transactions page also may include links to transaction traces and key transactions. The types of information available will depend on your selected app and the type of request (web or non-web).
Wall-clock time
Wall-clock time is the amount of time recorded by the clock. New Relic uses wall-clock time for all the transactions and then sums that value across all of the transactions.
The host can execute requests in parallel, so you may see percentages over 100. For example, 100% would indicate that the execution time across all selected transactions is equal to the time expended when recording wall-clock time.
View transactions
To view information about your app's transaction requests:
- Do one of the following:
- Go to one.newrelic.com > APM > (select an app) > Monitor > Transactions.
- Go to one.newrelic.com > Explorer > (select an app) > Monitor > Transactions.
- If applicable: To change which available types of transactions appear, select the Type.
- Select the sort order, or keep the default.
- Select the type of view as a chart (default), histogram, or percentile, if available.
- To view additional details, use any of the transaction drill-down functions.
- To add a chart to a dashboard, mouse over the chart, then select the Add to a dashboard link that appears below it.
If a chart's background is light red, this indicates a time period when an alert condition's Critical threshold has been violated. To view the incident details in alerts, click the chart.
For more information, see the documentation about navigating core UI components in New Relic One.
Use drill-down functions
Use any of New Relic's standard user interface functions to drill down into detailed information. The Transactions page has additional drill-down functions.
Show all transactions
To view all available transactions as a table, select the Show all transactions table link. From here, use any of the available options:
- To change the sort order, select any column header.
- To export the data to a file with comma-separated values, select Export as CSV.
- To return to the previous chart view, select Back to top transactions.
CSV tables for ending now time periods are calculated at run time. They may show slightly higher values than what appears in the APM table.
For each transaction, the Show all transactions table includes these measurements:
Measurement | Definition |
|---|---|
Apdex | The average Apdex score for all transactions that occurred in the selected time range. Apdex scores marked with an |
Count | The total number of all transactions that occurred in the selected time range. |
Avg (ms) | The average time taken by all transactions in the selected time range. |
SD (ms) | The standard deviation of all timing measurements for all transactions in the selected time range. |
Min (ms) | The time taken by the fastest transaction in the selected time range. |
Max (ms) | The time taken by the slowest transaction in the selected time range. |
Total (ms) | The total amount of time taken by all transactions that occurred in the selected time range. |
Total (% time) | The total amount of time for all transactions of that type, expressed as a percentage of the total amount of time taken by all transactions. |
Dissat (%) | The percentage of the transactions that did not have satisfied Apdex scores. If you view transactions as a table, the All transactions row always contributes 100% of the app's total dissatisfaction, even if no responses are dissatisfying (100% of zero is zero). In this situation, 100% does not mean that all of your transactions are dissatisfying. The sum of all the other values in the Dissat (%) column is 100%. |
Additional functions
Here are some additional functions for the Transactions page's selected transaction.
If you want to... | Do this... |
|---|---|
View transactions for operations and other background tasks | Change the Type to Other transactions (or a specific type listed), then select a specific transaction. The Transactions page shows the top five transactions for this selection by wall-clock time, CPU usage, and memory usage. |
Track a transaction that is important to your business | Select the transaction's name, then select Track as key transaction. |
View transaction trace details | A transaction trace is a complete picture of a single transaction.
|
Examine logs for trace details | If you are using our logs in context feature, you can see any logs that are linked to your traces.
|
Add or view transaction segments |
|
View reports | You can also use the Web transactions analysis report for web transactions and the Background jobs analysis report for non-web transactions to compare the amount of time spent in throughput, total time in the transaction, average time to execute it, and Apdex score as applicable. |
Delete all transaction traces | CautionIf you select Delete all traces, you cannot recover them. |


