Handled exceptions help you identify significant factors contributing to poor mobile application experience, and use filterable data to find a resolution more quickly. You can also use the handled exceptions API to customize the data you send, and use NRQL to query and share the data.
Handled exceptions workflow
To get the most out of the Handled exceptions UI, use this basic workflow:
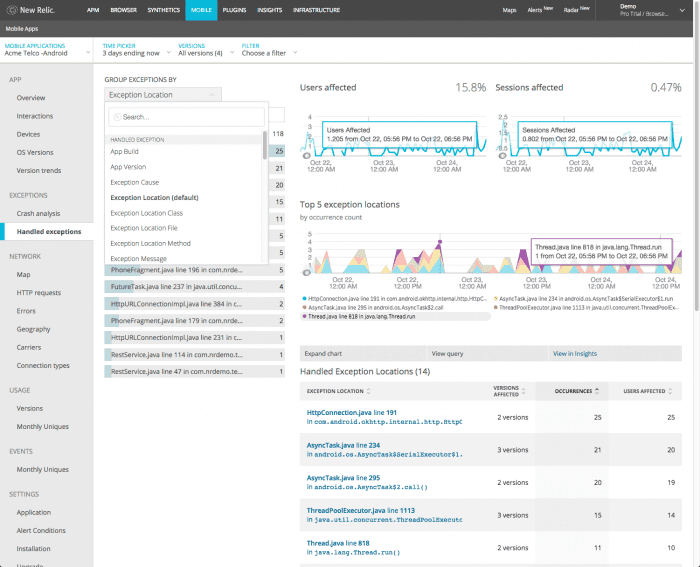
- Go to one.newrelic.com > Mobile > (select an app) > Exceptions > Handled exceptions.
- Use any of New Relic's standard page functions to drill down into detailed information; for example, zoom into any area of a chart.
- Look for obvious or general trends in the Users affected and Sessions affected percentage charts.
- Adjust the types of exceptions shown by using groups and filters.
- Optional: Query or share the chart data.
- Look for similar patterns where exceptions appear in stack traces with the Top 5 exception locations table.
- To view stack trace thread details for each occurrence of the exception, select a record from the Top 5 exceptions location table.
one.newrelic.com > Mobile > (select an app) > Exceptions > Handled exceptions: As you explore the wealth of data in the charts and table, use groups and filters to discover patterns that help you determine the root cause of mobile app exceptions.
Exception percentage charts
Start with the Users affected and Sessions affected percentage charts to see at a glance whether there are any unexpected spikes, dips, or patterns with exceptions in general. (If the Users affected chart is empty, there were no user sessions during the selected time period.) For example:
- Are there any spikes near a recent version release?
- Is there a time period when the percentage of users has been affected significantly by the exception?
- Are there uneventful periods?
To examine data in greater detail: Below any chart, select Expand chart.
Groups and filters
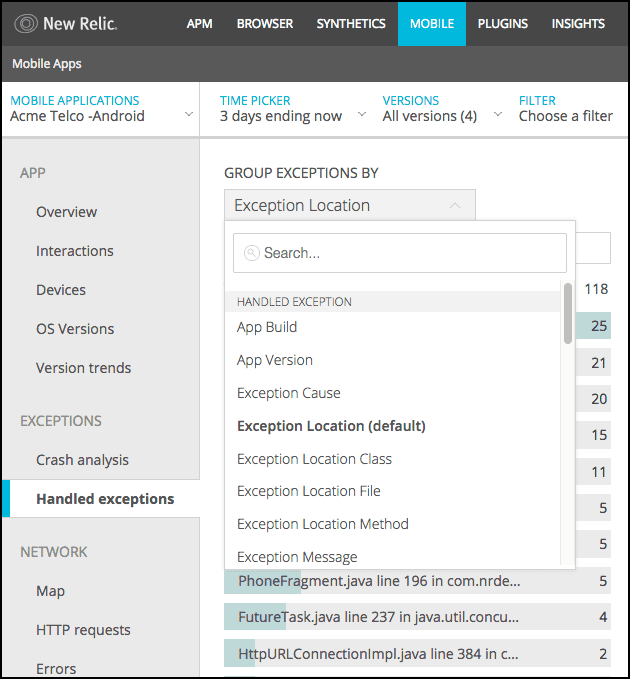
Use the groups and filters to examine attributes for crashes, devices, locations, or other custom attributes in more detail. You can select a group, then filter to specific data. For example:
- Group the list by exception location (default), cause, app build or version, devices, connections, or other custom attributes. This lets you discover patterns in your exceptions to determine the root cause.
- Use the time picker to adjust the currently selected time period.
- Filter by a specific Version or by one or more attribute Filter, such as
appVersion,exceptionLocationMethod,lastInteraction, or any of the longer list of standard and custom attributes.
The currently selected filters appear at the top of the UI page. You can close them, add other filters, or select other groups and filters.
Top five exception locations
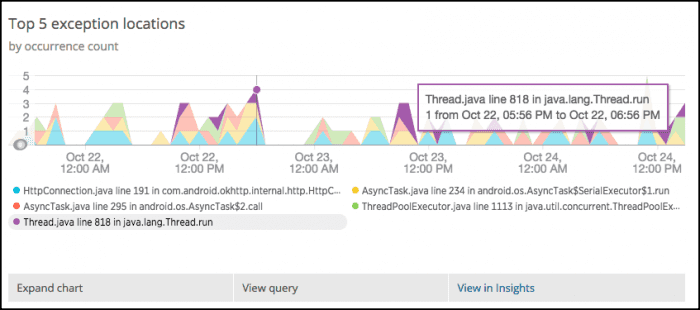
Use the Top 5 exception locations table to find or sort patterns in the type of exception you selected from the groups and filters. This includes:
- Recurring locations in the stack trace
- Mobile app version
- Number of occurrences
- Number of users affected during the selected time period
For example, you can group by Exception Message, filter to timeout message, then select individual timeout locations from the table to review the stack trace thread and details about each occurrence.
- To filter or group by other attributes, use the table's search window, or select any of the available filters. For example, filter by type of occurrence, device, a specific location, or any custom attributes.
- To look for other historical patterns, change the selected time period.
Query builder links
Handled exceptions charts use default attributes for mobile events (including MobileHandledException), along with any custom attributes you have added to this event type. When you mouse over the charts, direct links appear below them. These links to the query builder allow you to analyze your mobile app data even deeper.
- View query link: View the NRQL query used to calculate the chart data.
- View in query builder link: View the chart, and share it with others.
Exception locations table
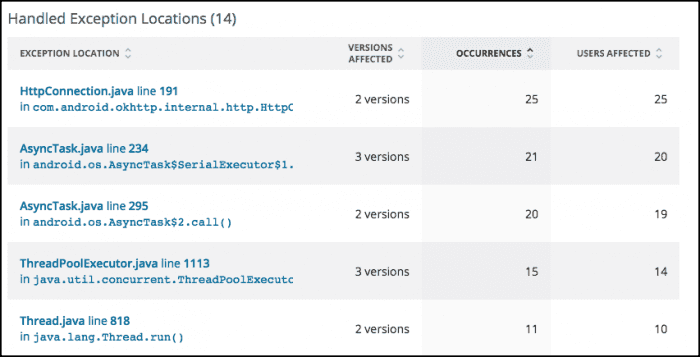
The Exception locations table supplements the charts. It lists where the top five handled exceptions appear in their stack trace thread, and links them to relevant details. Each row helps you find answers to questions such as:
- How many of this exception occurred within the selected time period?
- Does a specific app version have a higher (or lower) number of users affected?
- Which exception has the fewest number of occurrences?
You can change the sort order or filter options to focus on just the types of exceptions that matter the most to you and your teams. To view additional thread details for each occurrence of the exception, select a record from the Top 5 exceptions location table.


